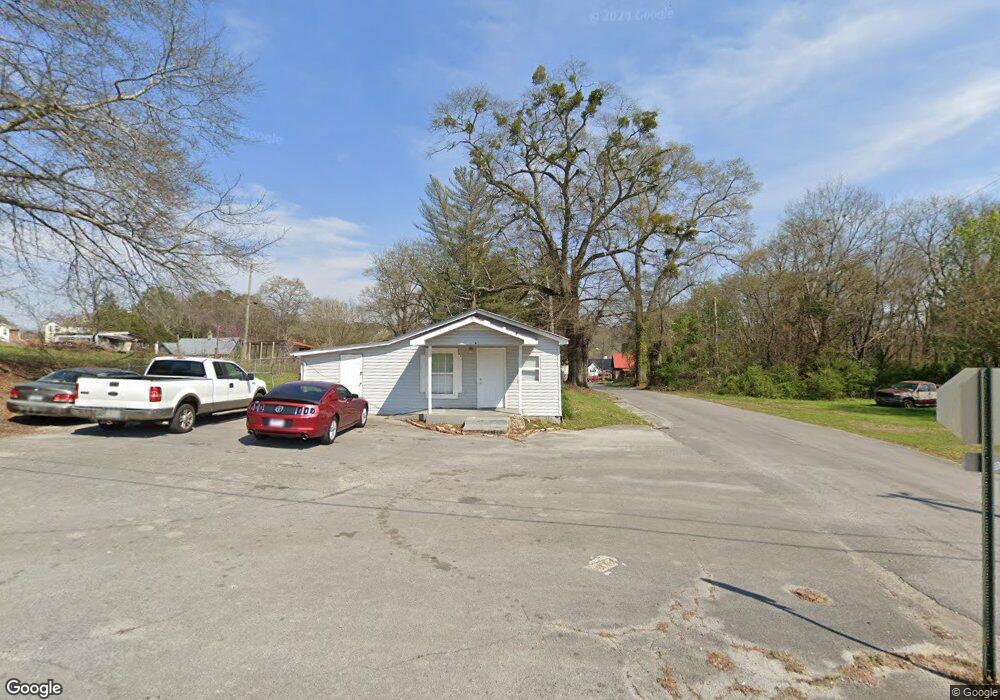
39 Fortune St La Fayette, GA 30728
Estimated Value: $104,000 - $160,000
--
Bed
--
Bath
972
Sq Ft
$130/Sq Ft
Est. Value
About This Home
This home is located at 39 Fortune St, La Fayette, GA 30728 and is currently estimated at $126,421, approximately $130 per square foot. 39 Fortune St is a home with nearby schools including North Lafayette Elementary School, Lafayette Middle School, and Lafayette High School.
Ownership History
Date
Name
Owned For
Owner Type
Purchase Details
Closed on
Apr 13, 2007
Sold by
Burgess Shulanda A
Bought by
Wallin Jaems R
Current Estimated Value
Home Financials for this Owner
Home Financials are based on the most recent Mortgage that was taken out on this home.
Original Mortgage
$28,349
Interest Rate
6.1%
Mortgage Type
Commercial
Purchase Details
Closed on
Apr 20, 2000
Sold by
Thompson Mary Elizabeth
Bought by
Burgess Shulanda A
Purchase Details
Closed on
Oct 20, 1991
Sold by
Thompson Randy
Bought by
Thompson Mary Elizabeth
Purchase Details
Closed on
Oct 17, 1991
Sold by
Simmons Edward E
Bought by
Thompson Randy
Purchase Details
Closed on
Oct 29, 1975
Sold by
Edgar Simmons
Bought by
Simmons Edward E
Purchase Details
Closed on
Jan 1, 1972
Bought by
Edgar Simmons
Create a Home Valuation Report for This Property
The Home Valuation Report is an in-depth analysis detailing your home's value as well as a comparison with similar homes in the area
Home Values in the Area
Average Home Value in this Area
Purchase History
| Date | Buyer | Sale Price | Title Company |
|---|---|---|---|
| Wallin Jaems R | $22,165 | -- | |
| Burgess Shulanda A | -- | -- | |
| Thompson Mary Elizabeth | -- | -- | |
| Thompson Randy | $35,000 | -- | |
| Simmons Edward E | $4,500 | -- | |
| Edgar Simmons | -- | -- |
Source: Public Records
Mortgage History
| Date | Status | Borrower | Loan Amount |
|---|---|---|---|
| Closed | Wallin Jaems R | $28,349 |
Source: Public Records
Tax History Compared to Growth
Tax History
| Year | Tax Paid | Tax Assessment Tax Assessment Total Assessment is a certain percentage of the fair market value that is determined by local assessors to be the total taxable value of land and additions on the property. | Land | Improvement |
|---|---|---|---|---|
| 2024 | $898 | $37,688 | $2,112 | $35,576 |
| 2023 | $868 | $35,351 | $1,624 | $33,727 |
| 2022 | $907 | $34,450 | $1,624 | $32,826 |
| 2021 | $317 | $10,797 | $1,624 | $9,173 |
| 2020 | $292 | $9,508 | $1,624 | $7,884 |
| 2019 | $292 | $9,508 | $1,624 | $7,884 |
| 2018 | $283 | $9,508 | $1,624 | $7,884 |
| 2017 | $316 | $9,508 | $1,624 | $7,884 |
| 2016 | $262 | $9,508 | $1,624 | $7,884 |
| 2015 | $231 | $7,972 | $952 | $7,020 |
| 2014 | $222 | $7,972 | $952 | $7,020 |
| 2013 | -- | $7,972 | $952 | $7,020 |
Source: Public Records
Map
Nearby Homes
- 1 & 3 N High St
- 13 Steele St N
- 3 Fortune St
- 0 Fortune St Unit 1520483
- 212 S High St
- 613 Bradley Ave
- 204 S High St
- 702.5 Henderson St
- 307 Park St
- 0 Center St Unit 1517720
- 207 Culberson Ave
- 205 Cavender St
- 206 Glenn St
- 301 Cedar St
- 306 Cedar St
- 312 Pine St
- 307 Cavender St
- 316 Chestnut St
- 317 Cedar St
- 0 W Main St Unit 1518094
- 0 Lower Mill Creek Rd Unit 9719 8285837
- 0 Lower Mill Creek Rd Unit 9719 8075930
- 0 Lower Mill Creek Rd Unit 90960
- 0 Lower Mill Creek Rd Unit 93555
- 0 Lower Mill Creek Rd Unit 9719-SE 8966089
- 35 Fortune St
- 32 Fortune St
- 40 Steele St N
- 34 Fortune St
- 47 Fortune St
- 47 Fortune St
- 42 Steele St N
- 34 Steele St N
- 1 Mill St
- 44 Steele St N
- 31 Fortune St
- 6 Mill St
- 48 Fortune St
- 30 Fortune St
- 50 Fortune St