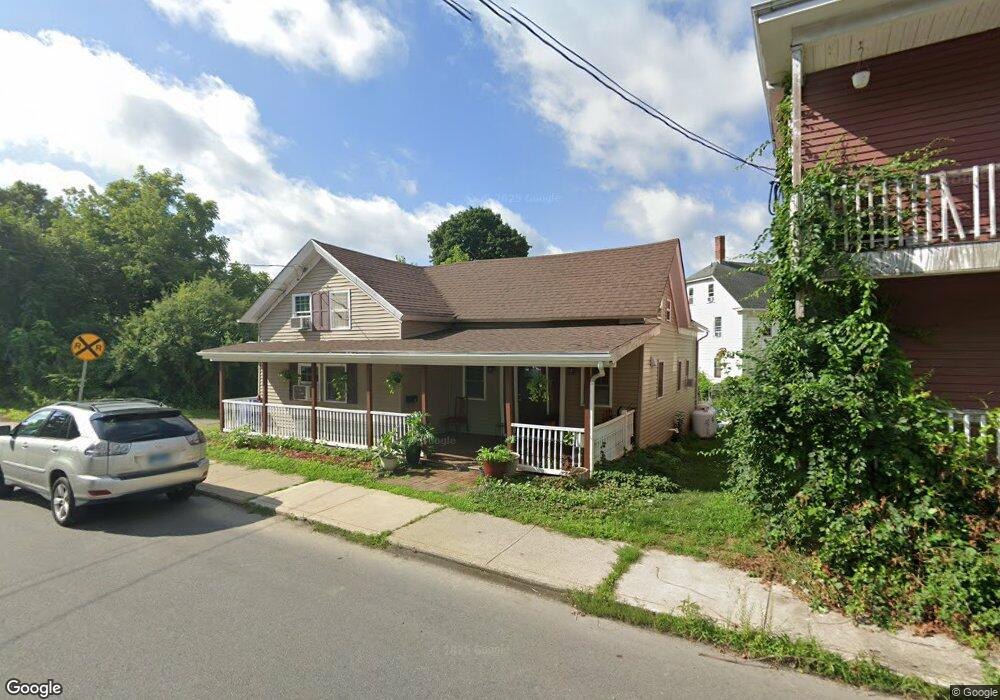
39 Franklin St Danielson, CT 06239
Estimated Value: $206,000 - $295,000
4
Beds
2
Baths
2,200
Sq Ft
$109/Sq Ft
Est. Value
About This Home
This home is located at 39 Franklin St, Danielson, CT 06239 and is currently estimated at $239,327, approximately $108 per square foot. 39 Franklin St is a home located in Windham County with nearby schools including Killingly Central School, Killingly Memorial School, and Killingly Intermediate School.
Ownership History
Date
Name
Owned For
Owner Type
Purchase Details
Closed on
Oct 4, 2024
Sold by
Phongsa Sukpaseuth and Phongsa Khamphanh
Bought by
T R Property Llc
Current Estimated Value
Home Financials for this Owner
Home Financials are based on the most recent Mortgage that was taken out on this home.
Original Mortgage
$214,100
Outstanding Balance
$211,426
Interest Rate
6.35%
Mortgage Type
Purchase Money Mortgage
Estimated Equity
$27,901
Purchase Details
Closed on
Mar 19, 2015
Sold by
Bounlutay Vanpheng
Bought by
Us Bank Na
Purchase Details
Closed on
Dec 29, 2009
Sold by
Bounlutay Vanpheng
Bought by
Bounlutay Viengsamay
Purchase Details
Closed on
Mar 29, 1990
Sold by
Munger Rodney
Bought by
Munger Mark
Create a Home Valuation Report for This Property
The Home Valuation Report is an in-depth analysis detailing your home's value as well as a comparison with similar homes in the area
Home Values in the Area
Average Home Value in this Area
Purchase History
| Date | Buyer | Sale Price | Title Company |
|---|---|---|---|
| T R Property Llc | $200,000 | None Available | |
| T R Property Llc | $200,000 | None Available | |
| T R Property Llc | $200,000 | None Available | |
| Us Bank Na | -- | -- | |
| Us Bank Na | -- | -- | |
| Bounlutay Viengsamay | -- | -- | |
| Bounlutay Viengsamay | -- | -- | |
| Munger Mark | $100,000 | -- |
Source: Public Records
Mortgage History
| Date | Status | Borrower | Loan Amount |
|---|---|---|---|
| Open | T R Property Llc | $214,100 | |
| Closed | T R Property Llc | $214,100 | |
| Previous Owner | Munger Mark | $65,000 | |
| Previous Owner | Munger Mark | $145,500 |
Source: Public Records
Tax History
| Year | Tax Paid | Tax Assessment Tax Assessment Total Assessment is a certain percentage of the fair market value that is determined by local assessors to be the total taxable value of land and additions on the property. | Land | Improvement |
|---|---|---|---|---|
| 2025 | $3,254 | $129,890 | $19,650 | $110,240 |
| 2024 | $3,106 | $129,890 | $19,650 | $110,240 |
| 2023 | $2,630 | $81,970 | $6,090 | $75,880 |
| 2022 | $2,475 | $81,970 | $6,090 | $75,880 |
| 2021 | $2,475 | $81,970 | $6,090 | $75,880 |
| 2020 | $2,434 | $81,970 | $6,090 | $75,880 |
| 2019 | $2,460 | $81,970 | $6,090 | $75,880 |
| 2017 | $2,351 | $72,870 | $6,090 | $66,780 |
| 2016 | $2,351 | $72,870 | $6,090 | $66,780 |
| 2015 | $2,303 | $72,870 | $6,090 | $66,780 |
| 2014 | $2,249 | $72,870 | $6,090 | $66,780 |
Source: Public Records
Map
Nearby Homes
Your Personal Tour Guide
Ask me questions while you tour the home.