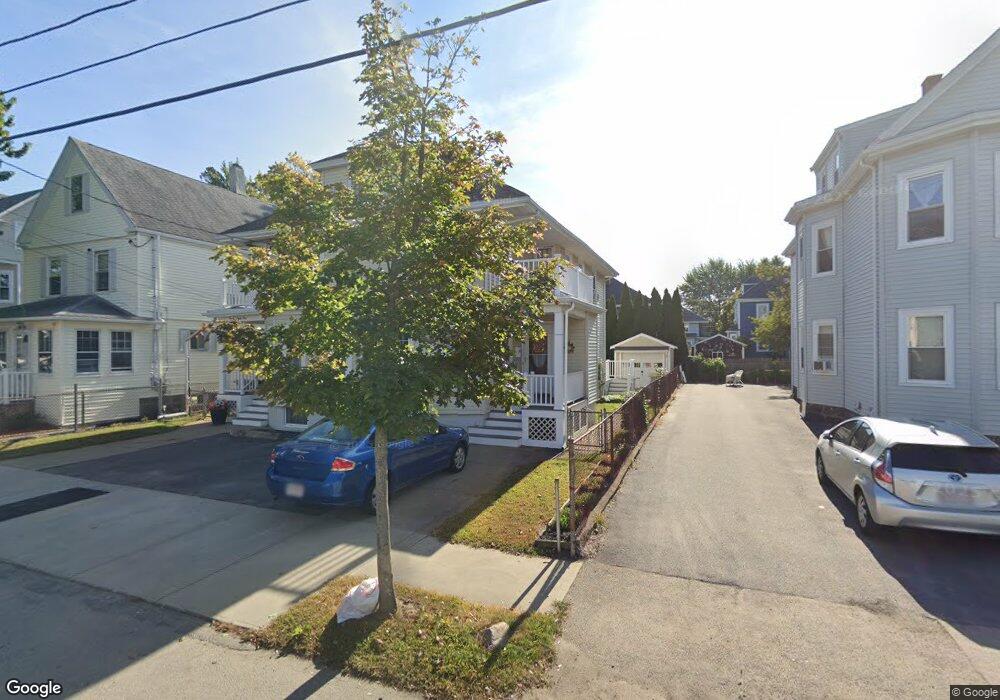
39 Freeman St Quincy, MA 02170
North Quincy NeighborhoodEstimated Value: $892,000 - $1,049,000
6
Beds
2
Baths
2,270
Sq Ft
$422/Sq Ft
Est. Value
About This Home
This home is located at 39 Freeman St, Quincy, MA 02170 and is currently estimated at $957,854, approximately $421 per square foot. 39 Freeman St is a home located in Norfolk County with nearby schools including Francis W. Parker Elementary School, Atlantic Middle School, and North Quincy High School.
Ownership History
Date
Name
Owned For
Owner Type
Purchase Details
Closed on
May 9, 2016
Sold by
Panto Ft
Bought by
Panto Jean M
Current Estimated Value
Purchase Details
Closed on
Mar 13, 2012
Sold by
Panto Bartolo J and Panto Jean M
Bought by
Panto Ft and Panto Barolo J
Purchase Details
Closed on
Nov 10, 1966
Bought by
Panto Ft
Create a Home Valuation Report for This Property
The Home Valuation Report is an in-depth analysis detailing your home's value as well as a comparison with similar homes in the area
Home Values in the Area
Average Home Value in this Area
Purchase History
| Date | Buyer | Sale Price | Title Company |
|---|---|---|---|
| Panto Jean M | -- | -- | |
| Panto Ft | -- | -- | |
| Panto Ft | -- | -- |
Source: Public Records
Mortgage History
| Date | Status | Borrower | Loan Amount |
|---|---|---|---|
| Previous Owner | Panto Ft | $74,000 |
Source: Public Records
Tax History Compared to Growth
Tax History
| Year | Tax Paid | Tax Assessment Tax Assessment Total Assessment is a certain percentage of the fair market value that is determined by local assessors to be the total taxable value of land and additions on the property. | Land | Improvement |
|---|---|---|---|---|
| 2025 | $10,241 | $888,200 | $366,000 | $522,200 |
| 2024 | $9,843 | $873,400 | $366,000 | $507,400 |
| 2023 | $9,346 | $839,700 | $332,800 | $506,900 |
| 2022 | $8,882 | $741,400 | $266,200 | $475,200 |
| 2021 | $9,039 | $744,600 | $266,200 | $478,400 |
| 2020 | $8,904 | $716,300 | $261,000 | $455,300 |
| 2019 | $8,535 | $680,100 | $251,000 | $429,100 |
| 2018 | $8,093 | $606,700 | $239,000 | $367,700 |
| 2017 | $8,007 | $565,100 | $217,300 | $347,800 |
| 2016 | $7,171 | $499,400 | $197,500 | $301,900 |
| 2015 | $6,798 | $465,600 | $179,600 | $286,000 |
| 2014 | $6,027 | $405,600 | $179,600 | $226,000 |
Source: Public Records
Map
Nearby Homes
- 85 E Squantum St Unit 10
- 58 Bayfield Rd S
- 17 Holmes St Unit 2
- 17 Holmes St Unit 3
- 10 Weston Ave Unit 322
- 39 Fayette St Unit 403
- 297 Billings St
- 98 Safford St
- 201 Billings St
- 55 Copley St
- 22 Conant Rd
- 52 Hamilton Ave
- 154 N Central Ave
- 23 Myrtle St
- 175 Quincy Shore Dr Unit B24
- 165 Quincy Shore Dr Unit C63
- 197 Hobart St
- 212 Quincy Shore Dr
- 90 Quincy Shore Dr Unit 701
- 90 Quincy Shore Dr Unit 501
- 43 Freeman St
- 35 Freeman St Unit 1
- 35 Freeman St
- 40-42 Tyler St
- 40 Tyler St
- 31 Freeman St
- 47 Freeman St
- 49 Freeman St Unit 2
- 47 Freeman St Unit 2
- 47 Freeman St Unit 3
- 49 Freeman St
- 47 Freeman St Unit 1
- 49 Freeman St Unit 3
- 49 Freeman St Unit 49
- 42 Tyler St Unit 1
- 42 Tyler St
- 38 Tyler St
- 44 Tyler St
- 34 Tyler St
- 40 Freeman St