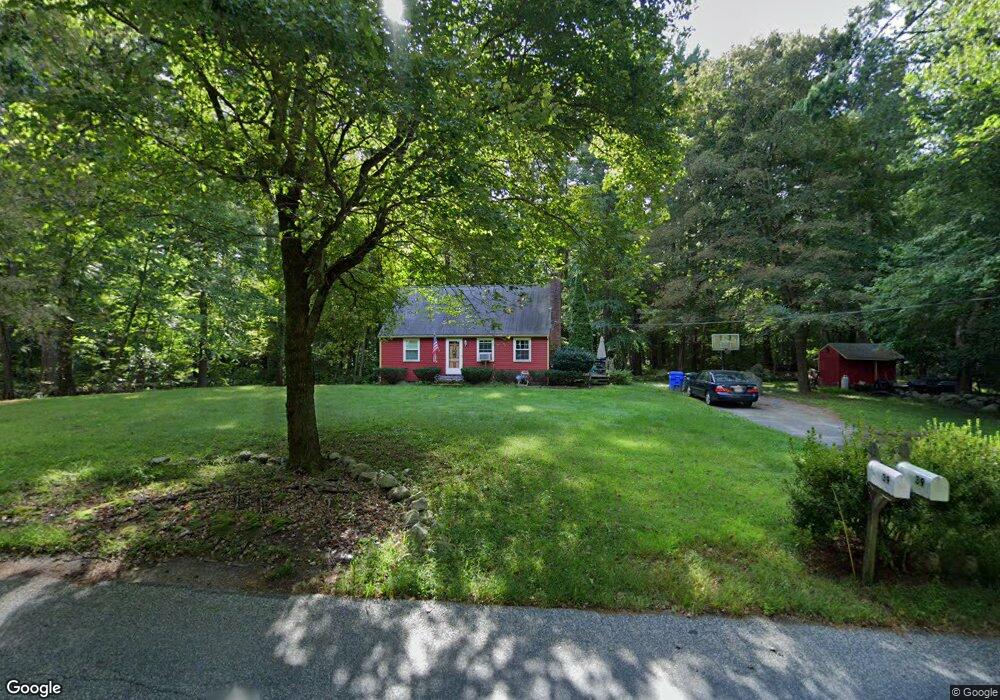
39 Front St Hopkinton, MA 01748
Estimated Value: $696,975 - $871,000
4
Beds
2
Baths
1,385
Sq Ft
$568/Sq Ft
Est. Value
About This Home
This home is located at 39 Front St, Hopkinton, MA 01748 and is currently estimated at $786,744, approximately $568 per square foot. 39 Front St is a home located in Middlesex County with nearby schools including Marathon Elementary School, Hopkins Elementary School, and Elmwood Elementary School.
Ownership History
Date
Name
Owned For
Owner Type
Purchase Details
Closed on
Nov 20, 2018
Sold by
Burgess David A and Burgess Darlene C
Bought by
Int David A Burgess
Current Estimated Value
Purchase Details
Closed on
Jun 29, 1994
Sold by
Mcmanus Michael T and Mcmanus Diane C
Bought by
Burgess David A and Burgess Darlene C
Home Financials for this Owner
Home Financials are based on the most recent Mortgage that was taken out on this home.
Original Mortgage
$153,000
Interest Rate
8.55%
Mortgage Type
Purchase Money Mortgage
Create a Home Valuation Report for This Property
The Home Valuation Report is an in-depth analysis detailing your home's value as well as a comparison with similar homes in the area
Home Values in the Area
Average Home Value in this Area
Purchase History
| Date | Buyer | Sale Price | Title Company |
|---|---|---|---|
| Int David A Burgess | -- | -- | |
| Burgess David A | $170,000 | -- |
Source: Public Records
Mortgage History
| Date | Status | Borrower | Loan Amount |
|---|---|---|---|
| Previous Owner | Burgess David A | $27,000 | |
| Previous Owner | Burgess David A | $143,000 | |
| Previous Owner | Burgess David A | $153,000 | |
| Previous Owner | Burgess David A | $53,500 |
Source: Public Records
Tax History Compared to Growth
Tax History
| Year | Tax Paid | Tax Assessment Tax Assessment Total Assessment is a certain percentage of the fair market value that is determined by local assessors to be the total taxable value of land and additions on the property. | Land | Improvement |
|---|---|---|---|---|
| 2025 | $8,845 | $623,800 | $318,500 | $305,300 |
| 2024 | $8,689 | $594,700 | $303,700 | $291,000 |
| 2023 | $8,479 | $536,300 | $268,000 | $268,300 |
| 2022 | $8,316 | $488,300 | $244,400 | $243,900 |
| 2021 | $8,069 | $472,400 | $237,500 | $234,900 |
| 2020 | $7,680 | $456,600 | $232,200 | $224,400 |
| 2019 | $7,368 | $429,100 | $227,900 | $201,200 |
| 2018 | $6,963 | $412,000 | $217,400 | $194,600 |
| 2017 | $6,382 | $379,900 | $211,500 | $168,400 |
| 2016 | $6,316 | $370,900 | $207,400 | $163,500 |
| 2015 | $6,383 | $355,400 | $201,800 | $153,600 |
Source: Public Records
Map
Nearby Homes
- 7 N Mill St
- 10 Clinton St
- 5 Frostpane Ln Unit 5
- 56 Woodland Rd
- 10 Emerson Way
- 2 Curtis Rd
- 180 Ash St
- 107 Olive St
- 52 S Mill St
- 101 Olive St
- 4 Myrtle Ave Unit 20
- 5 Myrtle Ave Unit 2
- 3 Fitch Ave Unit 14
- 6 Fitch Ave Unit 11
- 7 Myrtle Ave Unit 3
- 11 Fitch Ave Unit 18
- 13 Fitch Ave
- 13 Fitch Ave Unit 19
- Stockbridge Plan at Newbury Glen
- Williamstown Plan at Newbury Glen