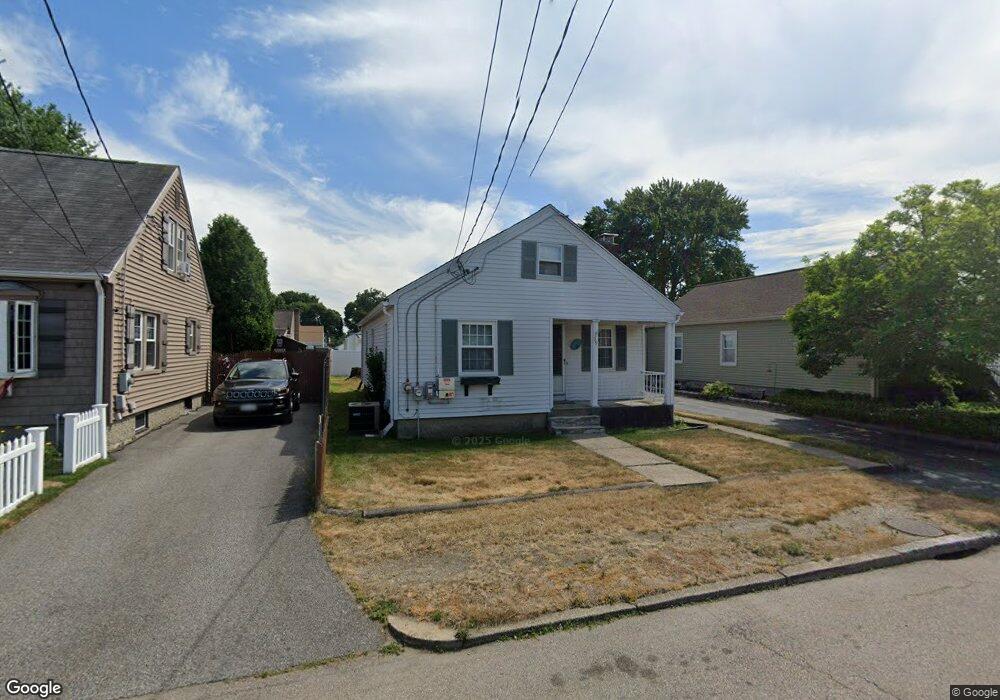
39 Fuller St Pawtucket, RI 02861
Darlington NeighborhoodEstimated Value: $361,000 - $378,000
2
Beds
1
Bath
1,274
Sq Ft
$291/Sq Ft
Est. Value
About This Home
This home is located at 39 Fuller St, Pawtucket, RI 02861 and is currently estimated at $371,092, approximately $291 per square foot. 39 Fuller St is a home located in Providence County with nearby schools including Saint Teresa Catholic Elementary School, St Cecilia School, and Saint Raphael Academy.
Ownership History
Date
Name
Owned For
Owner Type
Purchase Details
Closed on
Oct 26, 2022
Sold by
Mcconaghy Kathleen M
Bought by
Goula Jill A and Mcconaghy Kathleen M
Current Estimated Value
Purchase Details
Closed on
Jan 4, 2002
Sold by
Garvey Robert F and Garvey Janet
Bought by
Mcconaghy Kathleen M
Home Financials for this Owner
Home Financials are based on the most recent Mortgage that was taken out on this home.
Original Mortgage
$111,920
Interest Rate
6.72%
Purchase Details
Closed on
Oct 29, 1996
Sold by
Strynar Carl E
Bought by
Garvey Robert F and Garvey Janet
Home Financials for this Owner
Home Financials are based on the most recent Mortgage that was taken out on this home.
Original Mortgage
$84,757
Interest Rate
8.22%
Create a Home Valuation Report for This Property
The Home Valuation Report is an in-depth analysis detailing your home's value as well as a comparison with similar homes in the area
Home Values in the Area
Average Home Value in this Area
Purchase History
| Date | Buyer | Sale Price | Title Company |
|---|---|---|---|
| Goula Jill A | -- | None Available | |
| Mcconaghy Kathleen M | $140,000 | -- | |
| Garvey Robert F | $85,000 | -- |
Source: Public Records
Mortgage History
| Date | Status | Borrower | Loan Amount |
|---|---|---|---|
| Previous Owner | Garvey Robert F | $63,000 | |
| Previous Owner | Garvey Robert F | $130,000 | |
| Previous Owner | Garvey Robert F | $111,920 | |
| Previous Owner | Garvey Robert F | $84,757 |
Source: Public Records
Tax History
| Year | Tax Paid | Tax Assessment Tax Assessment Total Assessment is a certain percentage of the fair market value that is determined by local assessors to be the total taxable value of land and additions on the property. | Land | Improvement |
|---|---|---|---|---|
| 2025 | $3,998 | $304,000 | $125,700 | $178,300 |
| 2024 | $3,751 | $304,000 | $125,700 | $178,300 |
| 2023 | $3,823 | $225,700 | $84,500 | $141,200 |
| 2022 | $3,742 | $225,700 | $84,500 | $141,200 |
| 2021 | $3,742 | $225,700 | $84,500 | $141,200 |
| 2020 | $3,464 | $165,800 | $69,800 | $96,000 |
| 2019 | $3,464 | $165,800 | $69,800 | $96,000 |
| 2018 | $3,338 | $165,800 | $69,800 | $96,000 |
| 2017 | $3,092 | $136,100 | $62,900 | $73,200 |
| 2016 | $2,979 | $136,100 | $62,900 | $73,200 |
| 2015 | $2,979 | $136,100 | $62,900 | $73,200 |
| 2014 | $2,959 | $128,300 | $60,000 | $68,300 |
Source: Public Records
Map
Nearby Homes
Your Personal Tour Guide
Ask me questions while you tour the home.