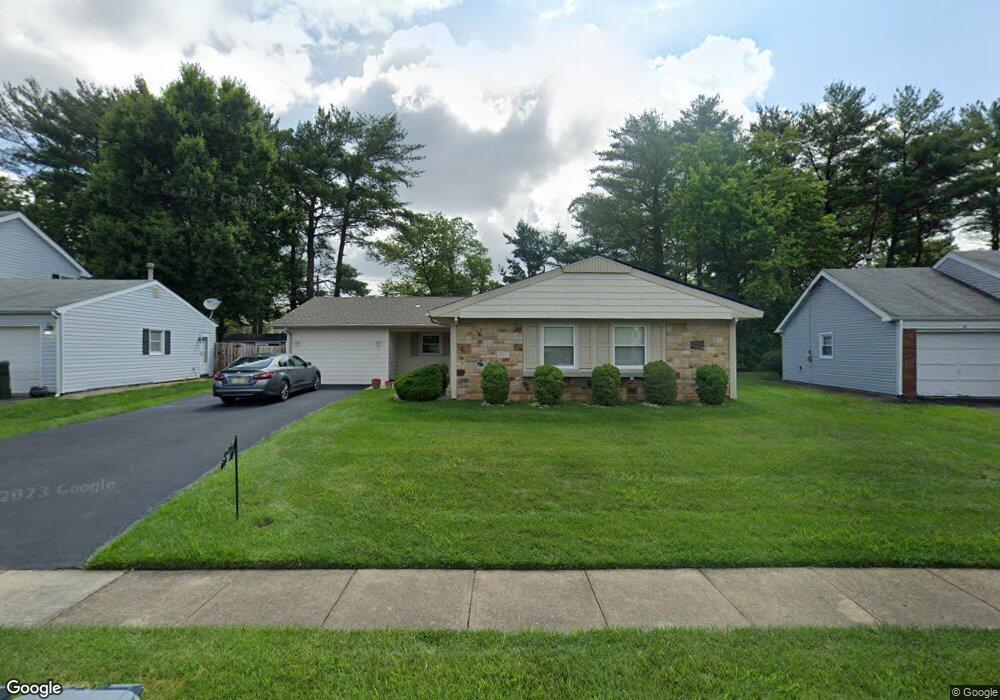
39 Goodwin Ln Willingboro, NJ 08046
Estimated Value: $258,926 - $388,000
Studio
--
Bath
1,843
Sq Ft
$191/Sq Ft
Est. Value
About This Home
This home is located at 39 Goodwin Ln, Willingboro, NJ 08046 and is currently estimated at $351,232, approximately $190 per square foot. 39 Goodwin Ln is a home located in Burlington County with nearby schools including Twin Hills Elementary School, Memorial Middle School, and James A. Cotten Intermediate School.
Ownership History
Date
Name
Owned For
Owner Type
Purchase Details
Closed on
Nov 11, 1997
Sold by
Jones Edna M
Bought by
Henderson Evonne
Current Estimated Value
Home Financials for this Owner
Home Financials are based on the most recent Mortgage that was taken out on this home.
Original Mortgage
$76,074
Outstanding Balance
$12,463
Interest Rate
7.26%
Mortgage Type
FHA
Estimated Equity
$338,769
Create a Home Valuation Report for This Property
The Home Valuation Report is an in-depth analysis detailing your home's value as well as a comparison with similar homes in the area
Home Values in the Area
Average Home Value in this Area
Purchase History
| Date | Buyer | Sale Price | Title Company |
|---|---|---|---|
| Henderson Evonne | $93,000 | -- |
Source: Public Records
Mortgage History
| Date | Status | Borrower | Loan Amount |
|---|---|---|---|
| Open | Henderson Evonne | $76,074 |
Source: Public Records
Tax History
| Year | Tax Paid | Tax Assessment Tax Assessment Total Assessment is a certain percentage of the fair market value that is determined by local assessors to be the total taxable value of land and additions on the property. | Land | Improvement |
|---|---|---|---|---|
| 2025 | $7,222 | $167,300 | $34,000 | $133,300 |
| 2024 | $7,169 | $167,300 | $34,000 | $133,300 |
| 2023 | $7,169 | $167,300 | $34,000 | $133,300 |
| 2022 | $6,674 | $167,300 | $34,000 | $133,300 |
| 2021 | $6,685 | $167,300 | $34,000 | $133,300 |
| 2020 | $6,714 | $167,300 | $34,000 | $133,300 |
| 2019 | $6,650 | $167,300 | $34,000 | $133,300 |
| 2018 | $6,526 | $167,300 | $34,000 | $133,300 |
| 2017 | $6,344 | $167,300 | $34,000 | $133,300 |
| 2016 | $6,280 | $167,300 | $34,000 | $133,300 |
| 2015 | $6,065 | $167,300 | $34,000 | $133,300 |
| 2014 | $5,774 | $167,300 | $34,000 | $133,300 |
Source: Public Records
Map
Nearby Homes