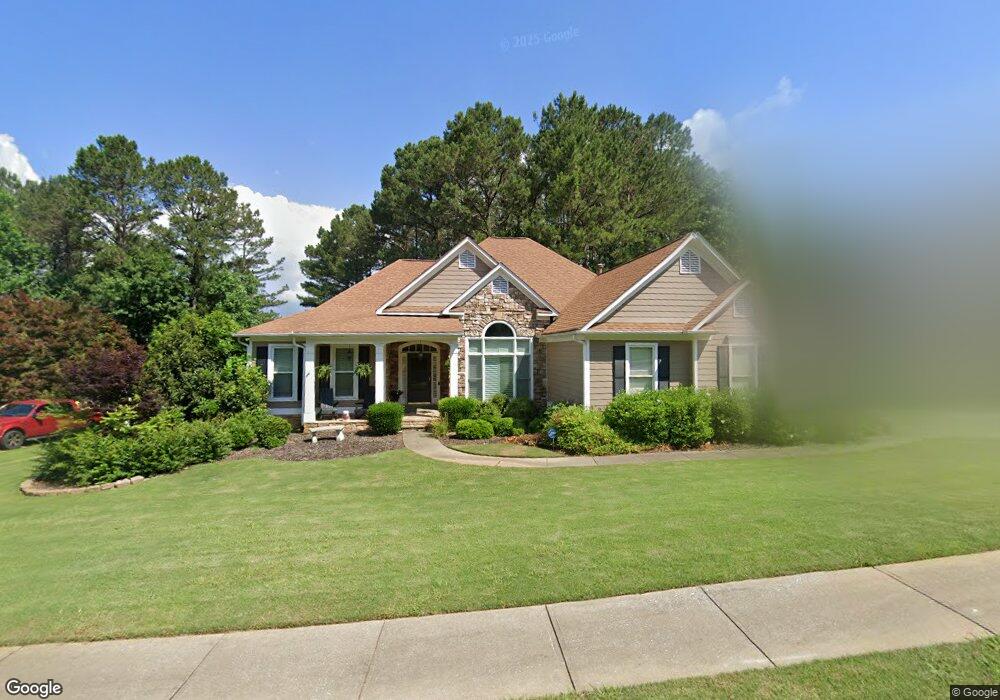
39 Graves Rd Unit E Acworth, GA 30101
Cedarcrest NeighborhoodEstimated Value: $482,293 - $529,000
4
Beds
4
Baths
2,153
Sq Ft
$237/Sq Ft
Est. Value
About This Home
This home is located at 39 Graves Rd Unit E, Acworth, GA 30101 and is currently estimated at $510,823, approximately $237 per square foot. 39 Graves Rd Unit E is a home located in Paulding County with nearby schools including Burnt Hickory Elementary School, Sammy Mcclure Sr. Middle School, and North Paulding High School.
Ownership History
Date
Name
Owned For
Owner Type
Purchase Details
Closed on
Oct 25, 2001
Sold by
Shellhaas Philip M
Bought by
Shellhaas Philip M
Current Estimated Value
Home Financials for this Owner
Home Financials are based on the most recent Mortgage that was taken out on this home.
Original Mortgage
$225,100
Interest Rate
6.5%
Mortgage Type
New Conventional
Purchase Details
Closed on
Oct 24, 2001
Sold by
Sharp Residential Builders
Home Financials for this Owner
Home Financials are based on the most recent Mortgage that was taken out on this home.
Original Mortgage
$225,100
Interest Rate
6.5%
Mortgage Type
New Conventional
Purchase Details
Closed on
Oct 22, 2001
Sold by
Shellhaas Philip M
Bought by
Shellhaas Philp M and Shellhaas Monica J
Home Financials for this Owner
Home Financials are based on the most recent Mortgage that was taken out on this home.
Original Mortgage
$225,100
Interest Rate
6.5%
Mortgage Type
New Conventional
Purchase Details
Closed on
Apr 18, 2001
Sold by
Temco Associates
Create a Home Valuation Report for This Property
The Home Valuation Report is an in-depth analysis detailing your home's value as well as a comparison with similar homes in the area
Home Values in the Area
Average Home Value in this Area
Purchase History
| Date | Buyer | Sale Price | Title Company |
|---|---|---|---|
| Shellhaas Philip M | -- | -- | |
| -- | $240,200 | -- | |
| Shellhaas Philp M | -- | -- | |
| Shellhaas Phil M | $240,200 | -- | |
| -- | $302,000 | -- |
Source: Public Records
Mortgage History
| Date | Status | Borrower | Loan Amount |
|---|---|---|---|
| Previous Owner | Shellhaas Phil M | $225,100 |
Source: Public Records
Tax History
| Year | Tax Paid | Tax Assessment Tax Assessment Total Assessment is a certain percentage of the fair market value that is determined by local assessors to be the total taxable value of land and additions on the property. | Land | Improvement |
|---|---|---|---|---|
| 2025 | $5,649 | $235,744 | $26,000 | $209,744 |
| 2024 | $5,268 | $215,028 | $26,000 | $189,028 |
| 2023 | $5,647 | $219,128 | $26,000 | $193,128 |
| 2022 | $4,453 | $172,688 | $26,000 | $146,688 |
| 2021 | $4,326 | $150,720 | $26,000 | $124,720 |
| 2020 | $4,012 | $136,932 | $26,000 | $110,932 |
| 2019 | $4,125 | $138,772 | $26,000 | $112,772 |
| 2018 | $3,769 | $126,952 | $26,000 | $100,952 |
| 2017 | $3,684 | $122,464 | $26,000 | $96,464 |
| 2016 | $3,422 | $115,040 | $26,000 | $89,040 |
| 2015 | $3,405 | $112,480 | $26,000 | $86,480 |
| 2014 | $3,256 | $105,000 | $26,000 | $79,000 |
| 2013 | -- | $87,680 | $26,000 | $61,680 |
Source: Public Records
Map
Nearby Homes
- 51 Newcomb Trace
- 88 Water Oak Dr
- 28 McEvers Branch Ct
- 198 Hickory Pointe Dr
- 365 Hunt Creek Dr
- 283 Hickory Pointe Dr
- 385 Graves Rd
- 434 Hunt Creek Dr
- 134 Grove Meadow Dr
- 229 McEvers Branch Landing
- 21 Cleburne Place
- 31 Evening Mist Dr
- 135 Vine Creek Place
- 1122 Flagstone Way
- 47 Vine Creek Ln
- 82 Buckthorn Way
- 1648 Harmony Grove Church Rd
- 1065 Lost Creek Pkwy
- 142 Floating Leaf Way
- 73 Turtle Rock Cove
- 67 Graves Rd
- 13 Graves Rd
- 38 Graves Rd
- 95 Graves Rd
- 52 Graves Rd Unit E
- 16 Graves Rd
- 119 Graves Rd
- 12 Crest Hollow Ln Unit E
- 11 Crest Hollow Ln
- 133 Graves Rd Unit E
- 11 Hickory Pointe Dr
- 34 Crest Hollow Ln
- 65 Hunt Creek Dr
- 130 Graves Rd
- 855 Harmony Grove Church Rd
- 33 Crest Hollow Ln
- 43 Hickory Pointe Dr
- 46 Crest Hollow Ln
- 45 Crest Hollow Ln Unit E
- 57 Hickory Pointe Dr
Your Personal Tour Guide
Ask me questions while you tour the home.