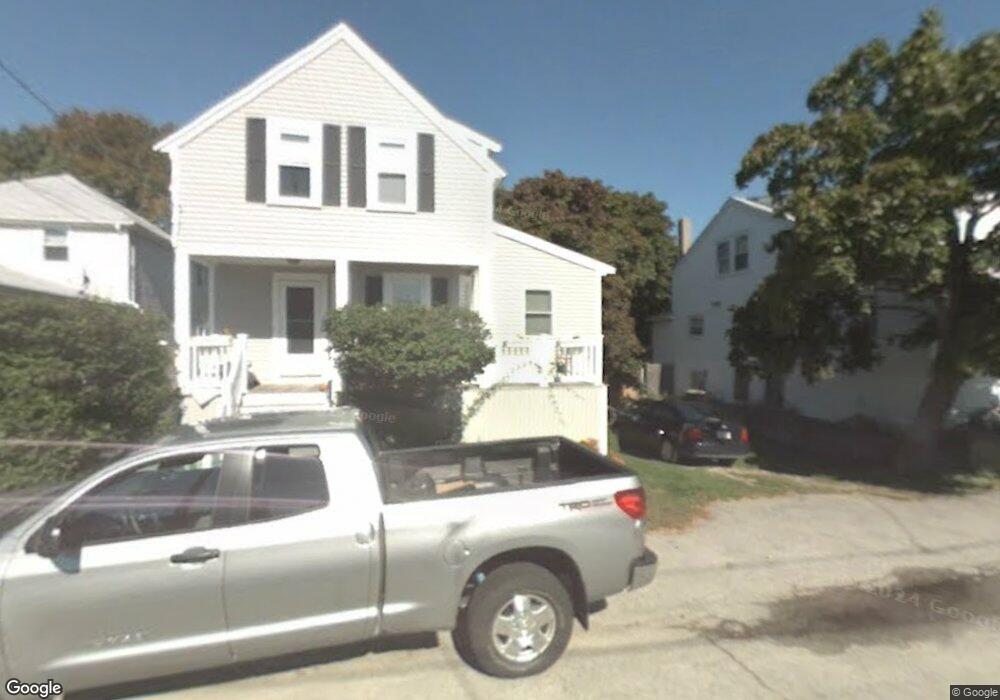
39 H St Unit yr rnd only Hull, MA 02045
The Alphabets NeighborhoodEstimated Value: $569,000 - $756,000
2
Beds
3
Baths
1,171
Sq Ft
$555/Sq Ft
Est. Value
About This Home
This home is located at 39 H St Unit yr rnd only, Hull, MA 02045 and is currently estimated at $649,972, approximately $555 per square foot. 39 H St Unit yr rnd only is a home located in Plymouth County with nearby schools including Lillian M. Jacobs Elementary School, Memorial Middle School, and Hull High School.
Ownership History
Date
Name
Owned For
Owner Type
Purchase Details
Closed on
Sep 23, 2019
Sold by
Muldoon Patrick and Muldoon Tara
Bought by
39 H Street Rt and Muldoon
Current Estimated Value
Purchase Details
Closed on
Mar 9, 2005
Sold by
Horan Leo J
Bought by
Muldoon Patrick and Muldoon Tara
Home Financials for this Owner
Home Financials are based on the most recent Mortgage that was taken out on this home.
Original Mortgage
$160,000
Interest Rate
5.64%
Mortgage Type
Purchase Money Mortgage
Create a Home Valuation Report for This Property
The Home Valuation Report is an in-depth analysis detailing your home's value as well as a comparison with similar homes in the area
Home Values in the Area
Average Home Value in this Area
Purchase History
| Date | Buyer | Sale Price | Title Company |
|---|---|---|---|
| 39 H Street Rt | -- | -- | |
| Muldoon Patrick | $200,000 | -- |
Source: Public Records
Mortgage History
| Date | Status | Borrower | Loan Amount |
|---|---|---|---|
| Previous Owner | Muldoon Patrick | $160,000 |
Source: Public Records
Tax History Compared to Growth
Tax History
| Year | Tax Paid | Tax Assessment Tax Assessment Total Assessment is a certain percentage of the fair market value that is determined by local assessors to be the total taxable value of land and additions on the property. | Land | Improvement |
|---|---|---|---|---|
| 2025 | $5,828 | $520,400 | $211,900 | $308,500 |
| 2024 | $5,749 | $493,500 | $202,100 | $291,400 |
| 2023 | $5,709 | $469,100 | $195,600 | $273,500 |
| 2022 | $5,543 | $442,000 | $182,600 | $259,400 |
| 2021 | $5,321 | $419,600 | $163,000 | $256,600 |
| 2020 | $5,133 | $400,400 | $169,500 | $230,900 |
| 2019 | $4,966 | $380,500 | $156,500 | $224,000 |
| 2018 | $4,736 | $352,900 | $156,500 | $196,400 |
| 2017 | $4,651 | $339,000 | $156,500 | $182,500 |
| 2016 | $4,393 | $325,900 | $143,400 | $182,500 |
| 2015 | $4,149 | $297,600 | $120,600 | $177,000 |
| 2014 | $3,992 | $287,800 | $110,800 | $177,000 |
Source: Public Records
Map
Nearby Homes