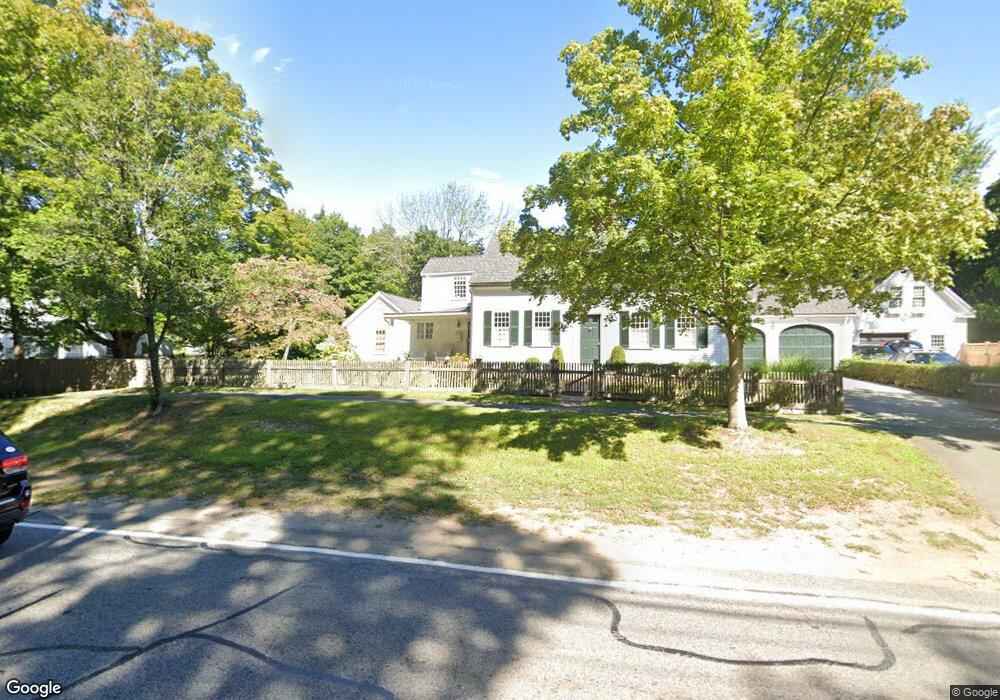
39 High St Hingham, MA 02043
Estimated Value: $1,211,000 - $1,461,000
4
Beds
3
Baths
2,456
Sq Ft
$527/Sq Ft
Est. Value
About This Home
This home is located at 39 High St, Hingham, MA 02043 and is currently estimated at $1,293,135, approximately $526 per square foot. 39 High St is a home located in Plymouth County with nearby schools including Plymouth River Elementary School, Hingham Middle School, and Hingham High School.
Ownership History
Date
Name
Owned For
Owner Type
Purchase Details
Closed on
May 26, 2011
Sold by
Farren Thomas E and Farren Christina S
Bought by
Golding William P and Warren Anne L
Current Estimated Value
Home Financials for this Owner
Home Financials are based on the most recent Mortgage that was taken out on this home.
Original Mortgage
$520,000
Interest Rate
4.94%
Mortgage Type
Purchase Money Mortgage
Purchase Details
Closed on
May 8, 2009
Sold by
Seem Andrew H and Seem Susanna M
Bought by
Farren Thomas E and Farren Christina S
Purchase Details
Closed on
Jun 15, 2007
Sold by
Birch Christopher P
Bought by
Seem Andrew H and Seem Susanna M
Purchase Details
Closed on
Sep 25, 2006
Sold by
Tose Lawrence and Tose Ariel W
Bought by
Birch Christopher P and Birch Jenny F
Create a Home Valuation Report for This Property
The Home Valuation Report is an in-depth analysis detailing your home's value as well as a comparison with similar homes in the area
Purchase History
| Date | Buyer | Sale Price | Title Company |
|---|---|---|---|
| Golding William P | $781,500 | -- | |
| Farren Thomas E | $714,200 | -- | |
| Seem Andrew H | $700,000 | -- | |
| Birch Christopher P | $625,000 | -- |
Source: Public Records
Mortgage History
| Date | Status | Borrower | Loan Amount |
|---|---|---|---|
| Open | Birch Christopher P | $465,700 | |
| Closed | Birch Christopher P | $43,000 | |
| Closed | Golding William P | $520,000 | |
| Closed | Birch Christopher P | $60,000 |
Source: Public Records
Tax History
| Year | Tax Paid | Tax Assessment Tax Assessment Total Assessment is a certain percentage of the fair market value that is determined by local assessors to be the total taxable value of land and additions on the property. | Land | Improvement |
|---|---|---|---|---|
| 2025 | $10,665 | $997,700 | $455,000 | $542,700 |
| 2024 | $10,640 | $980,600 | $455,000 | $525,600 |
| 2023 | $9,637 | $963,700 | $455,000 | $508,700 |
| 2022 | $8,934 | $772,800 | $351,200 | $421,600 |
| 2021 | $7,666 | $755,900 | $351,200 | $404,700 |
| 2020 | $7,564 | $755,900 | $351,200 | $404,700 |
| 2019 | $8,841 | $748,600 | $351,200 | $397,400 |
| 2018 | $8,670 | $736,600 | $351,200 | $385,400 |
| 2017 | $6,430 | $679,800 | $358,600 | $321,200 |
| 2016 | $8,277 | $662,700 | $341,500 | $321,200 |
| 2015 | $8,102 | $646,600 | $325,400 | $321,200 |
Source: Public Records
Map
Nearby Homes
Your Personal Tour Guide
Ask me questions while you tour the home.