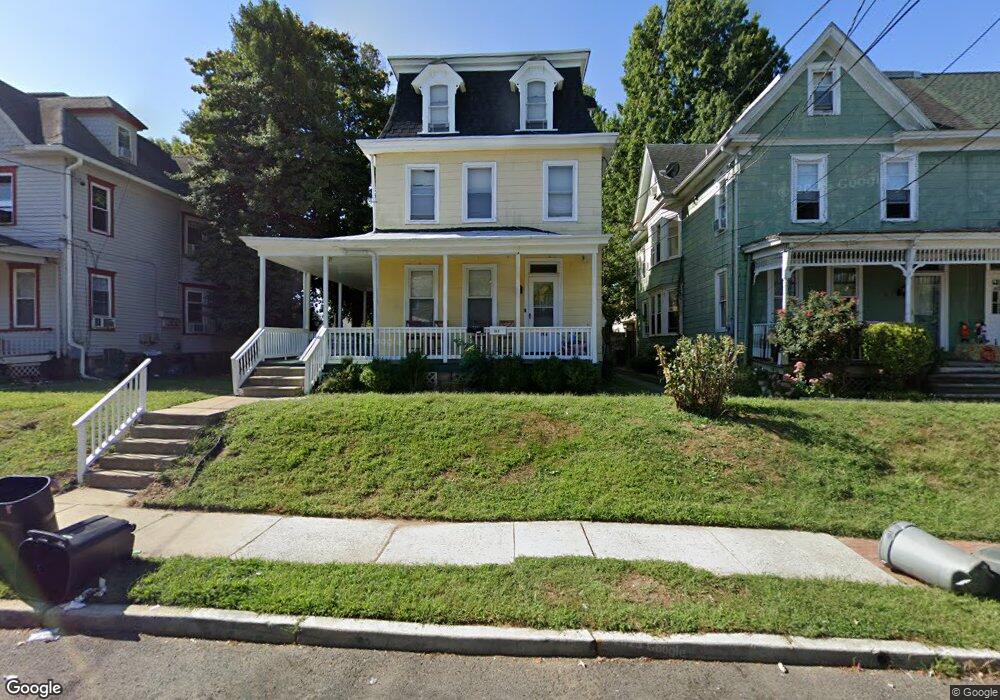
39 High St Unit A Woodbury, NJ 08096
Estimated Value: $252,890 - $295,000
3
Beds
1
Bath
1,500
Sq Ft
$182/Sq Ft
Est. Value
About This Home
This home is located at 39 High St Unit A, Woodbury, NJ 08096 and is currently estimated at $273,473, approximately $182 per square foot. 39 High St Unit A is a home located in Gloucester County with nearby schools including Woodbury Junior/Senior High School, Holy Angels Catholic School, and St Margaret Regional School.
Ownership History
Date
Name
Owned For
Owner Type
Purchase Details
Closed on
Apr 9, 2013
Sold by
Daurruche Van and Daurruche Van A
Bought by
First Station Real Estate Llc
Current Estimated Value
Purchase Details
Closed on
Jan 17, 2006
Sold by
Moore Linda J
Bought by
Dautruche Van A and Dautrache Elienne
Home Financials for this Owner
Home Financials are based on the most recent Mortgage that was taken out on this home.
Original Mortgage
$198,000
Interest Rate
6.23%
Mortgage Type
Purchase Money Mortgage
Create a Home Valuation Report for This Property
The Home Valuation Report is an in-depth analysis detailing your home's value as well as a comparison with similar homes in the area
Home Values in the Area
Average Home Value in this Area
Purchase History
| Date | Buyer | Sale Price | Title Company |
|---|---|---|---|
| First Station Real Estate Llc | $8,000 | North American Title Agenc | |
| Dautruche Van A | $220,000 | -- |
Source: Public Records
Mortgage History
| Date | Status | Borrower | Loan Amount |
|---|---|---|---|
| Previous Owner | Dautruche Van A | $198,000 |
Source: Public Records
Tax History Compared to Growth
Tax History
| Year | Tax Paid | Tax Assessment Tax Assessment Total Assessment is a certain percentage of the fair market value that is determined by local assessors to be the total taxable value of land and additions on the property. | Land | Improvement |
|---|---|---|---|---|
| 2025 | $6,312 | $131,200 | $33,400 | $97,800 |
| 2024 | $6,088 | $131,200 | $33,400 | $97,800 |
| 2023 | $6,088 | $131,200 | $33,400 | $97,800 |
| 2022 | $5,980 | $131,200 | $33,400 | $97,800 |
| 2021 | $5,901 | $131,200 | $33,400 | $97,800 |
| 2020 | $6,775 | $137,200 | $33,500 | $103,700 |
| 2019 | $6,547 | $137,200 | $33,500 | $103,700 |
| 2018 | $6,402 | $137,200 | $33,500 | $103,700 |
| 2017 | $6,793 | $148,100 | $33,500 | $114,600 |
| 2016 | $6,699 | $148,100 | $33,500 | $114,600 |
| 2015 | $6,589 | $148,100 | $33,500 | $114,600 |
| 2014 | $6,485 | $148,100 | $33,500 | $114,600 |
Source: Public Records
Map
Nearby Homes