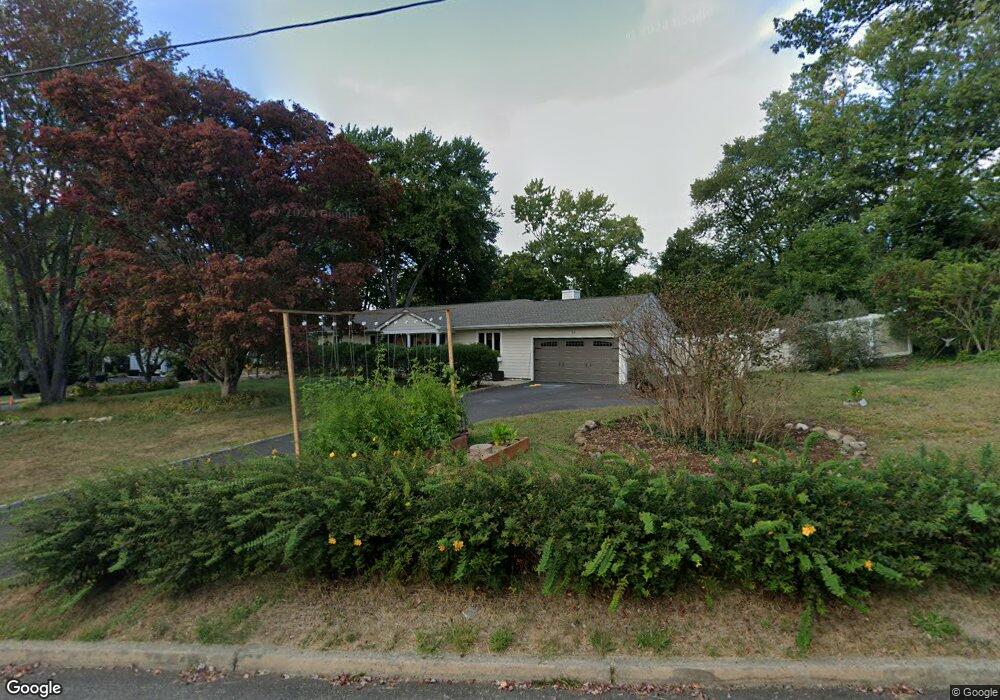
39 Highview Cir Middletown, NJ 07748
New Monmouth NeighborhoodEstimated Value: $680,000 - $779,000
3
Beds
3
Baths
2,097
Sq Ft
$351/Sq Ft
Est. Value
About This Home
This home is located at 39 Highview Cir, Middletown, NJ 07748 and is currently estimated at $736,053, approximately $351 per square foot. 39 Highview Cir is a home located in Monmouth County with nearby schools including Bayview Elementary School, Bayshore Middle School, and Middletown High School North.
Ownership History
Date
Name
Owned For
Owner Type
Purchase Details
Closed on
Apr 8, 2024
Sold by
Guzman David and Scholl Catherine
Bought by
Guzman David and Scholl Catherine
Current Estimated Value
Home Financials for this Owner
Home Financials are based on the most recent Mortgage that was taken out on this home.
Original Mortgage
$410,000
Outstanding Balance
$395,783
Interest Rate
6.88%
Mortgage Type
New Conventional
Estimated Equity
$340,270
Purchase Details
Closed on
May 29, 1998
Sold by
Hentschel Harry
Bought by
Guzman David
Home Financials for this Owner
Home Financials are based on the most recent Mortgage that was taken out on this home.
Original Mortgage
$168,000
Interest Rate
7.09%
Create a Home Valuation Report for This Property
The Home Valuation Report is an in-depth analysis detailing your home's value as well as a comparison with similar homes in the area
Home Values in the Area
Average Home Value in this Area
Purchase History
| Date | Buyer | Sale Price | Title Company |
|---|---|---|---|
| Guzman David | -- | Foundation Title | |
| Redacted Upon Request | -- | Foundation Title | |
| Guzman David | $210,000 | -- |
Source: Public Records
Mortgage History
| Date | Status | Borrower | Loan Amount |
|---|---|---|---|
| Open | Redacted Upon Request | $410,000 | |
| Closed | Redacted Upon Request | $410,000 | |
| Previous Owner | Guzman David | $168,000 |
Source: Public Records
Tax History Compared to Growth
Tax History
| Year | Tax Paid | Tax Assessment Tax Assessment Total Assessment is a certain percentage of the fair market value that is determined by local assessors to be the total taxable value of land and additions on the property. | Land | Improvement |
|---|---|---|---|---|
| 2025 | $10,454 | $646,500 | $370,500 | $276,000 |
| 2024 | $9,828 | $635,500 | $364,600 | $270,900 |
| 2023 | $9,828 | $565,500 | $302,900 | $262,600 |
| 2022 | $9,306 | $509,400 | $254,500 | $254,900 |
| 2021 | $9,306 | $447,400 | $220,700 | $226,700 |
| 2020 | $9,360 | $437,800 | $216,200 | $221,600 |
| 2019 | $9,219 | $436,500 | $216,200 | $220,300 |
| 2018 | $9,192 | $424,200 | $214,200 | $210,000 |
| 2017 | $9,209 | $420,700 | $214,200 | $206,500 |
| 2016 | $8,801 | $413,000 | $214,200 | $198,800 |
| 2015 | $9,062 | $410,600 | $214,200 | $196,400 |
| 2014 | $8,909 | $393,700 | $214,200 | $179,500 |
Source: Public Records
Map
Nearby Homes