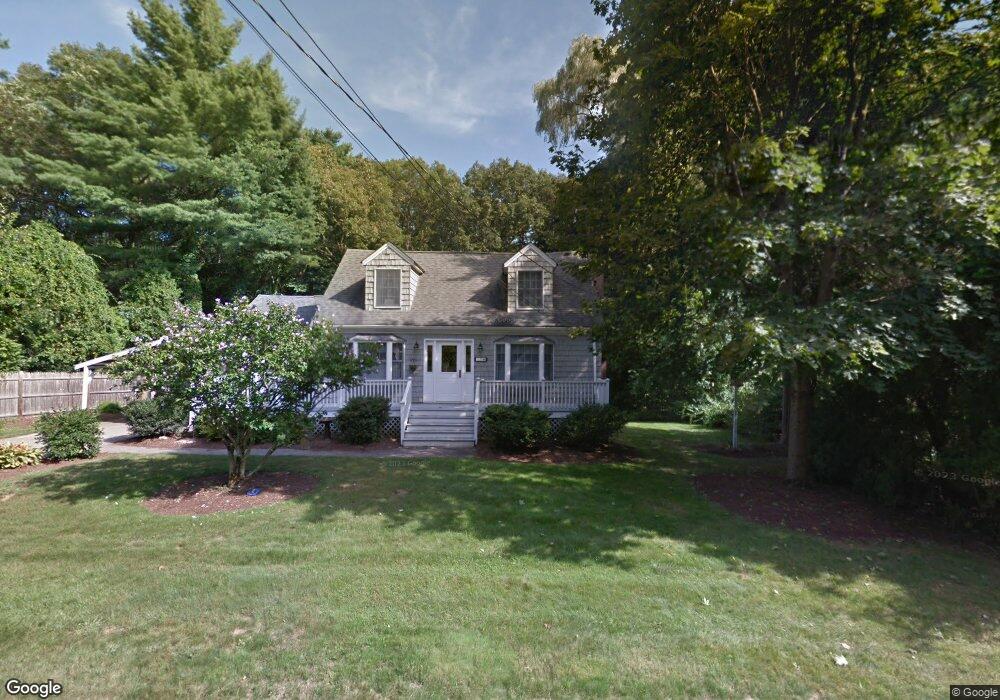
39 Hilltop Dr Millis, MA 02054
Estimated Value: $584,000 - $667,124
3
Beds
2
Baths
1,654
Sq Ft
$382/Sq Ft
Est. Value
About This Home
This home is located at 39 Hilltop Dr, Millis, MA 02054 and is currently estimated at $632,531, approximately $382 per square foot. 39 Hilltop Dr is a home located in Norfolk County with nearby schools including Clyde F Brown, Millis Middle School, and Millis High School.
Ownership History
Date
Name
Owned For
Owner Type
Purchase Details
Closed on
Jan 13, 2003
Sold by
Est Hunt Mary L and Hunt Robert F
Bought by
Laduke Kevin P and Laduke Lori A
Current Estimated Value
Home Financials for this Owner
Home Financials are based on the most recent Mortgage that was taken out on this home.
Original Mortgage
$252,000
Outstanding Balance
$108,837
Interest Rate
6.19%
Mortgage Type
Purchase Money Mortgage
Estimated Equity
$523,694
Create a Home Valuation Report for This Property
The Home Valuation Report is an in-depth analysis detailing your home's value as well as a comparison with similar homes in the area
Home Values in the Area
Average Home Value in this Area
Purchase History
| Date | Buyer | Sale Price | Title Company |
|---|---|---|---|
| Laduke Kevin P | $315,000 | -- |
Source: Public Records
Mortgage History
| Date | Status | Borrower | Loan Amount |
|---|---|---|---|
| Open | Laduke Kevin P | $252,000 |
Source: Public Records
Tax History Compared to Growth
Tax History
| Year | Tax Paid | Tax Assessment Tax Assessment Total Assessment is a certain percentage of the fair market value that is determined by local assessors to be the total taxable value of land and additions on the property. | Land | Improvement |
|---|---|---|---|---|
| 2025 | $10,130 | $617,700 | $234,600 | $383,100 |
| 2024 | $9,300 | $566,400 | $216,500 | $349,900 |
| 2023 | $8,701 | $497,500 | $172,600 | $324,900 |
| 2022 | $8,704 | $461,000 | $185,200 | $275,800 |
| 2021 | $7,972 | $406,300 | $160,100 | $246,200 |
| 2020 | $8,255 | $409,900 | $149,600 | $260,300 |
| 2019 | $7,198 | $384,900 | $136,600 | $248,300 |
| 2018 | $6,936 | $384,900 | $136,600 | $248,300 |
| 2017 | $6,178 | $335,400 | $117,300 | $218,100 |
| 2016 | $5,849 | $335,400 | $117,300 | $218,100 |
| 2015 | $5,702 | $335,400 | $117,300 | $218,100 |
Source: Public Records
Map
Nearby Homes
- 25 Bayberry Cir Unit 25
- 28 Forest Rd
- 1380 Main St
- 136 Spring St
- 324 Union St Unit 6
- 2 Greenwood Dr
- 27 Pollard Dr
- 2 Gerald Ave
- 2 Country Village Way Unit 2
- 22 May Rd
- 2 April Way
- 6 April Way
- 10 April Way
- 33 Spencer St
- 23 Algonquin Rd
- 2 Spencer St
- 27 Whichita Rd
- 6 Rivendell Ln
- 210 Causeway St
- 75 Bridge St