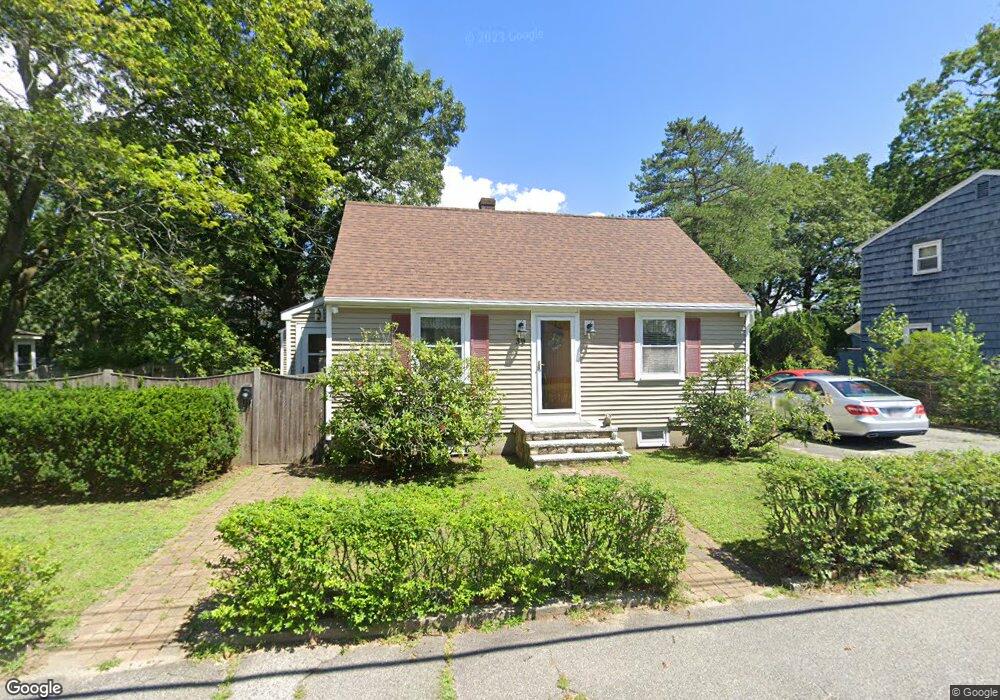
39 Hobson St Methuen, MA 01844
Downtown Methuen NeighborhoodEstimated Value: $491,000 - $548,000
2
Beds
2
Baths
1,310
Sq Ft
$393/Sq Ft
Est. Value
About This Home
This home is located at 39 Hobson St, Methuen, MA 01844 and is currently estimated at $515,164, approximately $393 per square foot. 39 Hobson St is a home located in Essex County with nearby schools including Tenney Grammar School, Methuen High School, and Lawrence Family Development Charter School.
Ownership History
Date
Name
Owned For
Owner Type
Purchase Details
Closed on
Oct 31, 2007
Sold by
Young Lisa and Lambert Lisa
Bought by
Young Richard and Young Lisa
Current Estimated Value
Purchase Details
Closed on
Jun 7, 2004
Sold by
Lambert David J and Lambert Lisa
Bought by
Lambert Lisa and Young Richard
Home Financials for this Owner
Home Financials are based on the most recent Mortgage that was taken out on this home.
Original Mortgage
$157,000
Interest Rate
5.94%
Mortgage Type
Purchase Money Mortgage
Purchase Details
Closed on
Oct 29, 1998
Sold by
Lambert Ann F
Bought by
Lambert David J
Home Financials for this Owner
Home Financials are based on the most recent Mortgage that was taken out on this home.
Original Mortgage
$109,250
Interest Rate
6.68%
Mortgage Type
Purchase Money Mortgage
Create a Home Valuation Report for This Property
The Home Valuation Report is an in-depth analysis detailing your home's value as well as a comparison with similar homes in the area
Home Values in the Area
Average Home Value in this Area
Purchase History
| Date | Buyer | Sale Price | Title Company |
|---|---|---|---|
| Young Richard | -- | -- | |
| Young Richard | -- | -- | |
| Lambert Lisa | -- | -- | |
| Lambert Lisa | -- | -- | |
| Lambert Lisa | -- | -- | |
| Lambert David J | $115,000 | -- |
Source: Public Records
Mortgage History
| Date | Status | Borrower | Loan Amount |
|---|---|---|---|
| Open | Lambert David J | $167,500 | |
| Previous Owner | Lambert Lisa | $157,000 | |
| Previous Owner | Lambert David J | $0 | |
| Previous Owner | Lambert David J | $113,400 | |
| Previous Owner | Lambert David J | $109,250 |
Source: Public Records
Tax History
| Year | Tax Paid | Tax Assessment Tax Assessment Total Assessment is a certain percentage of the fair market value that is determined by local assessors to be the total taxable value of land and additions on the property. | Land | Improvement |
|---|---|---|---|---|
| 2025 | $4,709 | $445,100 | $199,800 | $245,300 |
| 2024 | $4,648 | $428,000 | $182,300 | $245,700 |
| 2023 | $4,363 | $372,900 | $162,000 | $210,900 |
| 2022 | $4,142 | $317,400 | $135,000 | $182,400 |
| 2021 | $3,948 | $299,300 | $128,300 | $171,000 |
| 2020 | $3,684 | $285,200 | $128,300 | $156,900 |
| 2019 | $3,630 | $257,000 | $114,800 | $142,200 |
| 2018 | $3,529 | $250,400 | $114,800 | $135,600 |
| 2017 | $3,472 | $237,000 | $114,800 | $122,200 |
| 2016 | $3,243 | $219,000 | $108,000 | $111,000 |
| 2015 | $3,116 | $213,400 | $108,000 | $105,400 |
Source: Public Records
Map
Nearby Homes
- 34 Burnham Rd Unit 301
- 37 Maplewood Ave
- 14-16 Cypress Ave
- 88-90 Columbus Ave
- 20 Ruskin Ave
- 42-44 Cypress Ave
- 8-10 Elsmere Ave
- 45 Middlebury St
- 20-22 Ashland Ave
- 767 Riverside Dr
- 24 Railroad St
- 1100 Essex St
- 1082 Essex St
- 7 Mystic St
- 2 Grove St
- 23 Chase St
- 7-9 Carleton Ct
- 46 Pelham St
- 50 Forest St
- 514 Lowell St