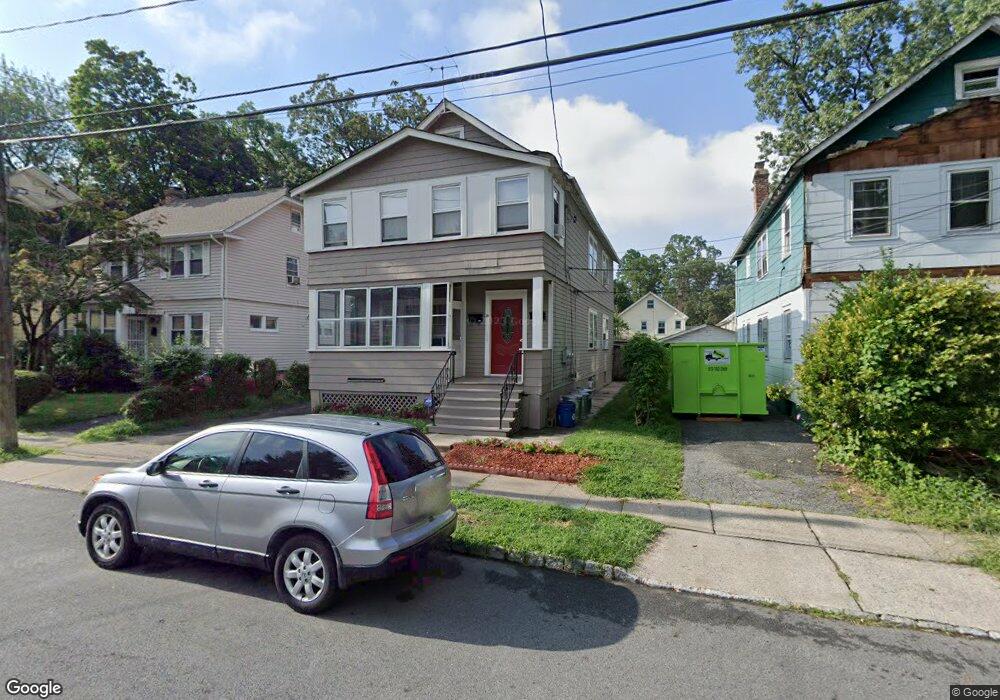
39 Howe Ave Unit 2 Montclair, NJ 07042
Estimated Value: $737,000 - $826,543
4
Beds
2
Baths
2,351
Sq Ft
$331/Sq Ft
Est. Value
About This Home
This home is located at 39 Howe Ave Unit 2, Montclair, NJ 07042 and is currently estimated at $778,136, approximately $330 per square foot. 39 Howe Ave Unit 2 is a home located in Essex County with nearby schools including Nishuane School, Hillside School, and Bradford School.
Ownership History
Date
Name
Owned For
Owner Type
Purchase Details
Closed on
Dec 11, 2020
Sold by
Parker Investment Group Llc
Bought by
Barraza William and Angulo Monica Cardenas
Current Estimated Value
Home Financials for this Owner
Home Financials are based on the most recent Mortgage that was taken out on this home.
Original Mortgage
$483,312
Outstanding Balance
$430,292
Interest Rate
2.7%
Mortgage Type
FHA
Estimated Equity
$347,844
Purchase Details
Closed on
Jul 17, 2019
Sold by
Parker Arnold W Est
Bought by
Parker Investment Group
Home Financials for this Owner
Home Financials are based on the most recent Mortgage that was taken out on this home.
Original Mortgage
$350,000
Interest Rate
3.8%
Mortgage Type
New Conventional
Purchase Details
Closed on
Nov 30, 1992
Sold by
Payne Emma
Bought by
Parker Arnold W
Create a Home Valuation Report for This Property
The Home Valuation Report is an in-depth analysis detailing your home's value as well as a comparison with similar homes in the area
Home Values in the Area
Average Home Value in this Area
Purchase History
| Date | Buyer | Sale Price | Title Company |
|---|---|---|---|
| Barraza William | $500,000 | Belmont Ttl & Setmnt Svcs Ll | |
| Parker Investment Group | -- | -- | |
| Parker Arnold W | -- | -- | |
| Parker Arnold Westate Of | -- | -- |
Source: Public Records
Mortgage History
| Date | Status | Borrower | Loan Amount |
|---|---|---|---|
| Open | Barraza William | $483,312 | |
| Previous Owner | Parker Investment Group | $350,000 |
Source: Public Records
Tax History
| Year | Tax Paid | Tax Assessment Tax Assessment Total Assessment is a certain percentage of the fair market value that is determined by local assessors to be the total taxable value of land and additions on the property. | Land | Improvement |
|---|---|---|---|---|
| 2025 | $13,175 | $389,800 | $171,000 | $218,800 |
| 2024 | $13,175 | $389,800 | $171,000 | $218,800 |
| 2022 | $12,817 | $389,800 | $171,000 | $218,800 |
| 2021 | $12,339 | $381,900 | $171,000 | $210,900 |
| 2020 | $12,141 | $381,900 | $171,000 | $210,900 |
| 2019 | $12,015 | $381,900 | $171,000 | $210,900 |
| 2018 | $11,816 | $381,900 | $171,000 | $210,900 |
| 2017 | $12,184 | $326,300 | $111,000 | $215,300 |
| 2016 | $11,858 | $326,300 | $111,000 | $215,300 |
| 2015 | $11,505 | $326,300 | $111,000 | $215,300 |
| 2014 | $11,120 | $326,300 | $111,000 | $215,300 |
Source: Public Records
Map
Nearby Homes
- 17 Wilfred St
- 10 Harrison Ave
- 6 Franklin Ave
- 114 Elm St
- 168 Maple St
- 40 Franklin Place
- 20 Valley Way
- 114 Harrison Ave
- 425 Main St
- 12 Enfield Ave
- 2 Park Dr N
- 63 High St
- 38 Watchung Ave
- 24 Mountain Ave
- 44 Madison Ave
- 86 Watchung Ave
- 110 Whittlesey Ave
- 25 Melrose Place
- 1102 Smith Manor Blvd Unit 52
- 8 Madison Ave
Your Personal Tour Guide
Ask me questions while you tour the home.