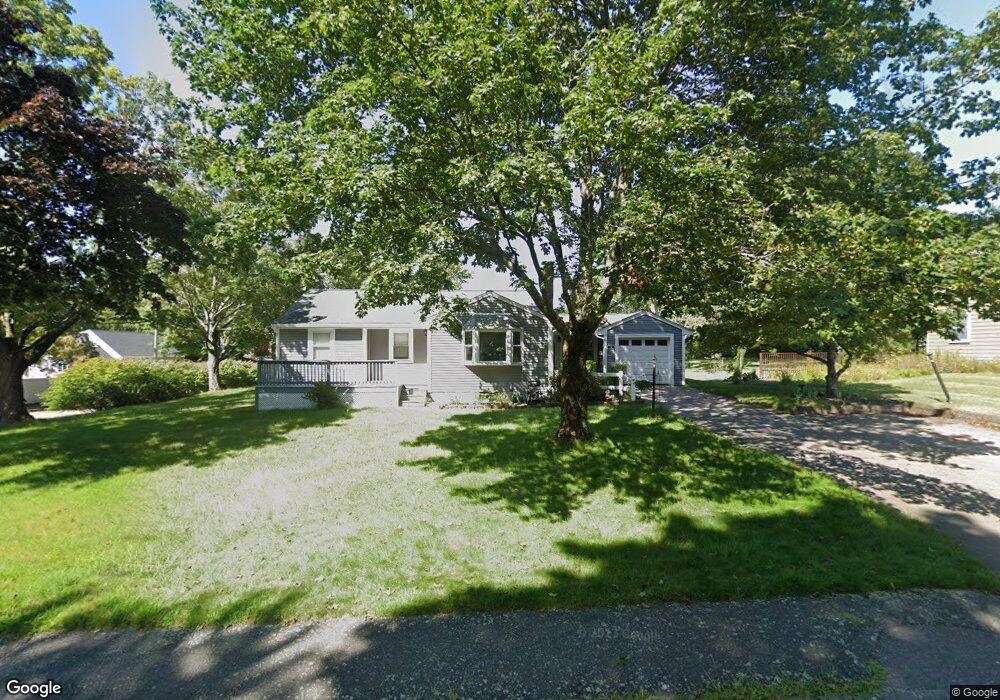
39 Irving Dr Walpole, MA 02081
Estimated Value: $644,000 - $669,000
3
Beds
1
Bath
1,137
Sq Ft
$579/Sq Ft
Est. Value
About This Home
This home is located at 39 Irving Dr, Walpole, MA 02081 and is currently estimated at $658,694, approximately $579 per square foot. 39 Irving Dr is a home located in Norfolk County with nearby schools including Boyden School, Eleanor N. Johnson Middle School, and Walpole High School.
Ownership History
Date
Name
Owned For
Owner Type
Purchase Details
Closed on
Apr 29, 2011
Sold by
Nolan Edward J and Nolan Marcia A
Bought by
Kraus Donal P
Current Estimated Value
Home Financials for this Owner
Home Financials are based on the most recent Mortgage that was taken out on this home.
Original Mortgage
$251,200
Outstanding Balance
$173,604
Interest Rate
4.76%
Mortgage Type
Purchase Money Mortgage
Estimated Equity
$485,090
Purchase Details
Closed on
Mar 9, 2011
Sold by
Nolan Mark E and Nolan Jennifer A
Bought by
Nolan Edward J and Nolan Marcia A
Home Financials for this Owner
Home Financials are based on the most recent Mortgage that was taken out on this home.
Original Mortgage
$251,200
Outstanding Balance
$173,604
Interest Rate
4.76%
Mortgage Type
Purchase Money Mortgage
Estimated Equity
$485,090
Purchase Details
Closed on
Mar 1, 2005
Sold by
Nolan Edward J and Nolan Jennifer A
Bought by
Nolan Jennifer A
Create a Home Valuation Report for This Property
The Home Valuation Report is an in-depth analysis detailing your home's value as well as a comparison with similar homes in the area
Home Values in the Area
Average Home Value in this Area
Purchase History
| Date | Buyer | Sale Price | Title Company |
|---|---|---|---|
| Kraus Donal P | $314,000 | -- | |
| Nolan Edward J | -- | -- | |
| Nolan Jennifer A | -- | -- |
Source: Public Records
Mortgage History
| Date | Status | Borrower | Loan Amount |
|---|---|---|---|
| Open | Kraus Donal P | $251,200 |
Source: Public Records
Tax History Compared to Growth
Tax History
| Year | Tax Paid | Tax Assessment Tax Assessment Total Assessment is a certain percentage of the fair market value that is determined by local assessors to be the total taxable value of land and additions on the property. | Land | Improvement |
|---|---|---|---|---|
| 2025 | $7,057 | $550,000 | $336,600 | $213,400 |
| 2024 | $6,831 | $516,700 | $323,600 | $193,100 |
| 2023 | $6,628 | $477,200 | $281,400 | $195,800 |
| 2022 | $6,293 | $435,200 | $260,700 | $174,500 |
| 2021 | $5,937 | $400,100 | $245,900 | $154,200 |
| 2020 | $5,921 | $395,000 | $232,000 | $163,000 |
| 2019 | $5,738 | $380,000 | $223,100 | $156,900 |
| 2018 | $5,256 | $344,200 | $215,100 | $129,100 |
| 2017 | $5,093 | $332,200 | $206,800 | $125,400 |
| 2016 | $5,027 | $323,100 | $198,900 | $124,200 |
| 2015 | $4,886 | $311,200 | $189,400 | $121,800 |
| 2014 | $4,695 | $297,900 | $189,400 | $108,500 |
Source: Public Records
Map
Nearby Homes
- 32 Irving Dr
- 8 Foxhill Dr
- 6 Sunset Dr
- 173 Beach St
- 2 Thompson Rd
- 35 Shoreline Dr
- 69 Morningside Dr
- 45 Beach St
- 0 U S Route 1
- 97 Old Post Rd
- 74 Ridge Rd
- 885 Old Post Rd
- 54 S Walpole St
- 2 Sterling Ln Unit 2
- 7 Beach St
- 1165 Washington St
- 4 Cheryl Dr
- 7 Carl Rd
- 635 Old Post Rd Unit 302
- 635 Old Post Rd Unit 110