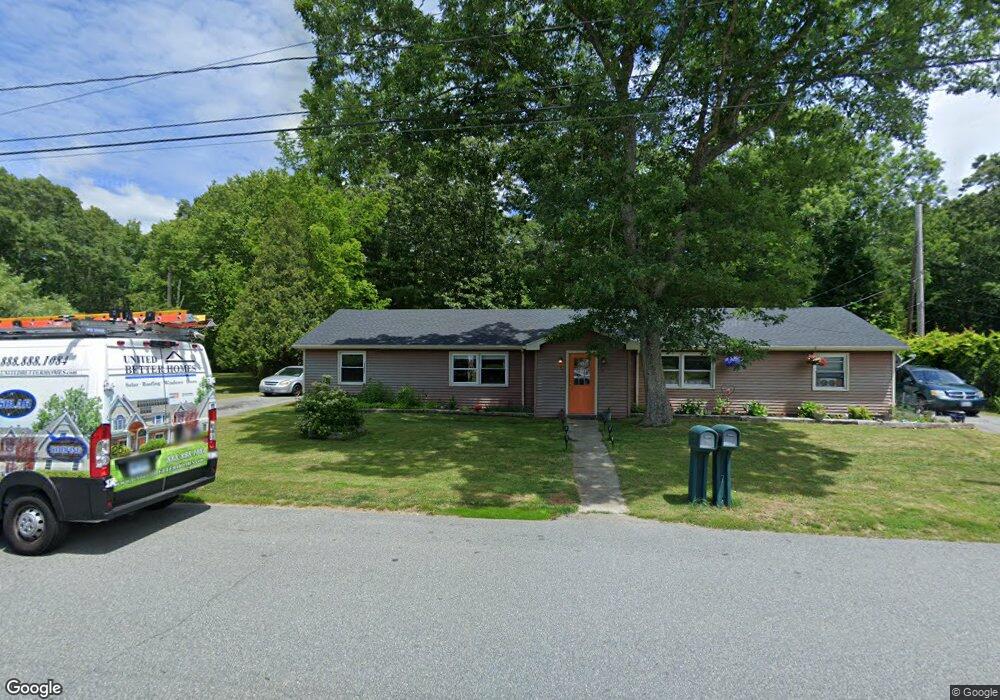
39 J Dr Unit 41 Westport, MA 02790
North Westport NeighborhoodEstimated Value: $412,000 - $593,000
4
Beds
--
Bath
1,632
Sq Ft
$288/Sq Ft
Est. Value
About This Home
This home is located at 39 J Dr Unit 41, Westport, MA 02790 and is currently estimated at $470,200, approximately $288 per square foot. 39 J Dr Unit 41 is a home located in Bristol County with nearby schools including Alice A. Macomber Primary School, Westport Elementary School, and Westport Middle-High School.
Ownership History
Date
Name
Owned For
Owner Type
Purchase Details
Closed on
Apr 17, 2013
Sold by
Kut Mark S
Bought by
Kut Sheila L
Current Estimated Value
Purchase Details
Closed on
Jan 16, 2002
Sold by
Angell Dawn M and Angell Steven A
Bought by
Kut Mark S and Kut Sheila L
Home Financials for this Owner
Home Financials are based on the most recent Mortgage that was taken out on this home.
Original Mortgage
$150,400
Interest Rate
6.84%
Mortgage Type
Purchase Money Mortgage
Purchase Details
Closed on
Apr 27, 1990
Sold by
Hall Pauline F
Bought by
Souza Dawn M
Home Financials for this Owner
Home Financials are based on the most recent Mortgage that was taken out on this home.
Original Mortgage
$117,000
Interest Rate
10.26%
Mortgage Type
Purchase Money Mortgage
Create a Home Valuation Report for This Property
The Home Valuation Report is an in-depth analysis detailing your home's value as well as a comparison with similar homes in the area
Home Values in the Area
Average Home Value in this Area
Purchase History
| Date | Buyer | Sale Price | Title Company |
|---|---|---|---|
| Kut Sheila L | -- | -- | |
| Kut Mark S | $188,000 | -- | |
| Souza Dawn M | $130,000 | -- |
Source: Public Records
Mortgage History
| Date | Status | Borrower | Loan Amount |
|---|---|---|---|
| Previous Owner | Souza Dawn M | $150,400 | |
| Previous Owner | Souza Dawn M | $117,000 |
Source: Public Records
Tax History Compared to Growth
Tax History
| Year | Tax Paid | Tax Assessment Tax Assessment Total Assessment is a certain percentage of the fair market value that is determined by local assessors to be the total taxable value of land and additions on the property. | Land | Improvement |
|---|---|---|---|---|
| 2025 | $2,593 | $348,000 | $166,200 | $181,800 |
| 2024 | $2,482 | $321,100 | $154,000 | $167,100 |
| 2023 | $2,429 | $297,700 | $140,300 | $157,400 |
| 2022 | $2,187 | $265,300 | $127,500 | $137,800 |
| 2021 | $2,187 | $253,700 | $115,900 | $137,800 |
| 2020 | $2,100 | $249,100 | $111,300 | $137,800 |
| 2019 | $2,058 | $248,900 | $111,300 | $137,600 |
| 2018 | $1,891 | $231,500 | $112,300 | $119,200 |
| 2017 | $1,798 | $225,600 | $108,700 | $116,900 |
| 2016 | $1,709 | $216,000 | $105,100 | $110,900 |
| 2015 | $1,641 | $206,900 | $107,500 | $99,400 |
Source: Public Records
Map
Nearby Homes