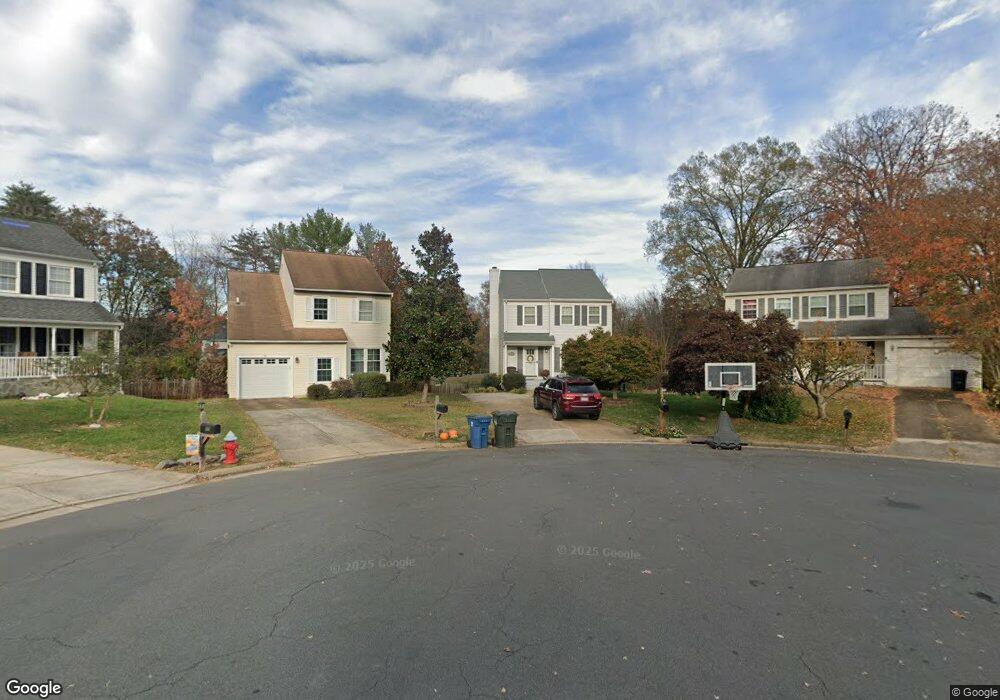
39 Jeremy Ct Sterling, VA 20165
Estimated Value: $680,678 - $747,000
4
Beds
4
Baths
1,772
Sq Ft
$404/Sq Ft
Est. Value
About This Home
This home is located at 39 Jeremy Ct, Sterling, VA 20165 and is currently estimated at $716,670, approximately $404 per square foot. 39 Jeremy Ct is a home located in Loudoun County with nearby schools including Countryside Elementary School, River Bend Middle School, and Potomac Falls High School.
Ownership History
Date
Name
Owned For
Owner Type
Purchase Details
Closed on
Oct 31, 2024
Sold by
Avilla Suzanne and Avilla Ian
Bought by
Suzanne G Adams Living Trust and Adams
Current Estimated Value
Purchase Details
Closed on
Jun 24, 2009
Sold by
Homesales Inc
Bought by
Avilla Ian
Home Financials for this Owner
Home Financials are based on the most recent Mortgage that was taken out on this home.
Original Mortgage
$260,000
Interest Rate
4.86%
Mortgage Type
New Conventional
Purchase Details
Closed on
Dec 17, 2004
Sold by
Kukorlo John N
Bought by
Pereira Wilfredo U and Moreno,Aleida M
Home Financials for this Owner
Home Financials are based on the most recent Mortgage that was taken out on this home.
Original Mortgage
$356,800
Interest Rate
5.68%
Mortgage Type
New Conventional
Create a Home Valuation Report for This Property
The Home Valuation Report is an in-depth analysis detailing your home's value as well as a comparison with similar homes in the area
Home Values in the Area
Average Home Value in this Area
Purchase History
| Date | Buyer | Sale Price | Title Company |
|---|---|---|---|
| Suzanne G Adams Living Trust | -- | None Listed On Document | |
| Avilla Ian | $325,000 | -- | |
| Pereira Wilfredo U | $446,000 | -- |
Source: Public Records
Mortgage History
| Date | Status | Borrower | Loan Amount |
|---|---|---|---|
| Previous Owner | Avilla Ian | $260,000 | |
| Previous Owner | Pereira Wilfredo U | $356,800 |
Source: Public Records
Tax History
| Year | Tax Paid | Tax Assessment Tax Assessment Total Assessment is a certain percentage of the fair market value that is determined by local assessors to be the total taxable value of land and additions on the property. | Land | Improvement |
|---|---|---|---|---|
| 2025 | $5,290 | $657,200 | $236,400 | $420,800 |
| 2024 | $5,501 | $635,960 | $216,400 | $419,560 |
| 2023 | $5,310 | $606,870 | $216,400 | $390,470 |
| 2022 | $5,121 | $575,440 | $206,400 | $369,040 |
| 2021 | $4,645 | $473,970 | $182,900 | $291,070 |
| 2020 | $4,599 | $444,370 | $177,900 | $266,470 |
| 2019 | $4,439 | $424,760 | $177,900 | $246,860 |
| 2018 | $4,426 | $407,900 | $177,900 | $230,000 |
| 2017 | $4,649 | $413,270 | $177,900 | $235,370 |
| 2016 | $4,492 | $392,320 | $0 | $0 |
| 2015 | $4,352 | $205,500 | $0 | $205,500 |
| 2014 | $4,475 | $229,580 | $0 | $229,580 |
Source: Public Records
Map
Nearby Homes
- 9 Dorrell Ct
- 21 Aldridge Ct
- 14 Marian Ct
- 34 Lipscomb Ct
- 20209 Redrose Dr
- 47 Quincy Ct
- 34 Palmer Ct
- 30 Gannon Way
- 130 Minor Rd
- 20150 Dairy Ln
- 45558 Lakemont Square
- 19141 Youngs Cliff Rd
- 20 N Lowery Ct
- 23 Jermyn Ct
- 105 Country Rd
- 119 Westwick Ct Unit 6
- 45070 Brae Terrace Unit 102
- 20639 Cutwater Place
- 45916 Swallow Terrace
- 45942 Raven Terrace
Your Personal Tour Guide
Ask me questions while you tour the home.