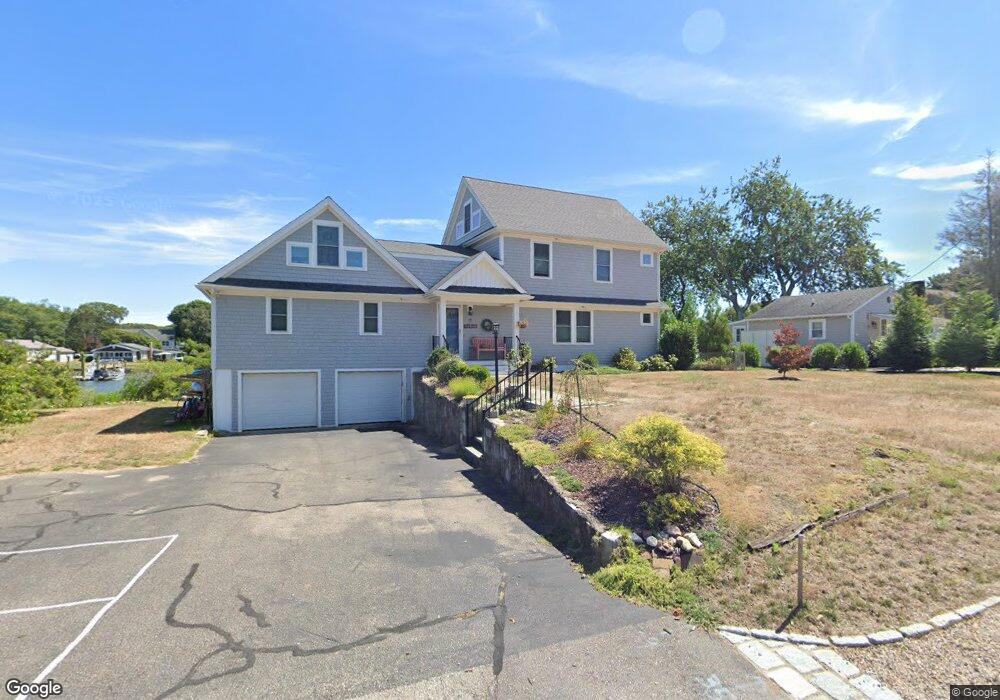
39 John St Wakefield, RI 02879
Estimated Value: $942,000 - $1,351,284
4
Beds
4
Baths
2,292
Sq Ft
$509/Sq Ft
Est. Value
About This Home
This home is located at 39 John St, Wakefield, RI 02879 and is currently estimated at $1,165,571, approximately $508 per square foot. 39 John St is a home located in Washington County with nearby schools including South Kingstown High School, Quest Montessori School, and Monsignor Matthew Clarke Catholic Regional School.
Ownership History
Date
Name
Owned For
Owner Type
Purchase Details
Closed on
Feb 17, 2026
Sold by
Johnson Helen
Bought by
Helen B Johnson Ret and Johnson
Current Estimated Value
Purchase Details
Closed on
Feb 12, 2026
Sold by
W Johnson Ft and Johnson
Bought by
Johnson Helen
Purchase Details
Closed on
Dec 21, 2018
Sold by
Borsay Ronald
Bought by
W Johnson Ft and Johnson
Purchase Details
Closed on
Nov 17, 1986
Bought by
Borsay Mary Joy A
Create a Home Valuation Report for This Property
The Home Valuation Report is an in-depth analysis detailing your home's value as well as a comparison with similar homes in the area
Home Values in the Area
Average Home Value in this Area
Purchase History
| Date | Buyer | Sale Price | Title Company |
|---|---|---|---|
| Helen B Johnson Ret | -- | -- | |
| Johnson Helen | -- | -- | |
| W Johnson Ft | $515,000 | -- | |
| Borsay Mary Joy A | -- | -- |
Source: Public Records
Mortgage History
| Date | Status | Borrower | Loan Amount |
|---|---|---|---|
| Previous Owner | Borsay Mary Joy A | $113,650 | |
| Previous Owner | Borsay Mary Joy A | $130,000 | |
| Previous Owner | Borsay Mary Joy A | $15,000 |
Source: Public Records
Tax History
| Year | Tax Paid | Tax Assessment Tax Assessment Total Assessment is a certain percentage of the fair market value that is determined by local assessors to be the total taxable value of land and additions on the property. | Land | Improvement |
|---|---|---|---|---|
| 2025 | $10,355 | $1,158,300 | $616,200 | $542,100 |
| 2024 | $9,998 | $904,800 | $473,500 | $431,300 |
| 2023 | $9,998 | $904,800 | $473,500 | $431,300 |
| 2022 | $9,908 | $904,800 | $473,500 | $431,300 |
| 2021 | $8,699 | $602,000 | $291,000 | $311,000 |
| 2020 | $8,699 | $602,000 | $291,000 | $311,000 |
| 2019 | $6,095 | $421,800 | $291,000 | $130,800 |
| 2018 | $6,012 | $383,400 | $270,500 | $112,900 |
| 2017 | $5,870 | $383,400 | $270,500 | $112,900 |
| 2016 | $5,786 | $383,400 | $270,500 | $112,900 |
| 2015 | $5,921 | $381,500 | $263,900 | $117,600 |
| 2014 | $5,906 | $381,500 | $263,900 | $117,600 |
Source: Public Records
Map
Nearby Homes
- 5 Wayland Trail
- 9 Edwards Ave
- 106 S Bay Dr
- 125 Montauk Rd
- 30 Crest Ave
- 0 Indian Run Trail Unit 1403300
- 36 Sachem Rd
- 0 Indian Trail Trail S Unit 1389828
- 727 Boston Neck Rd
- 416 Bridgetown Rd
- 54 Isabelle Dr
- 1029 Boston Neck Rd Unit 2
- 51 Bonnet Shores Rd
- 53 Bonnet Shores Rd
- 261 Saugatucket Rd
- 12 Park Ave Unit 13
- 55 Bonnet Shores Rd
- 60 Brooklyn Rd
- 137 Bonnet Shores Rd
- 7 Bayberry Rd
Your Personal Tour Guide
Ask me questions while you tour the home.