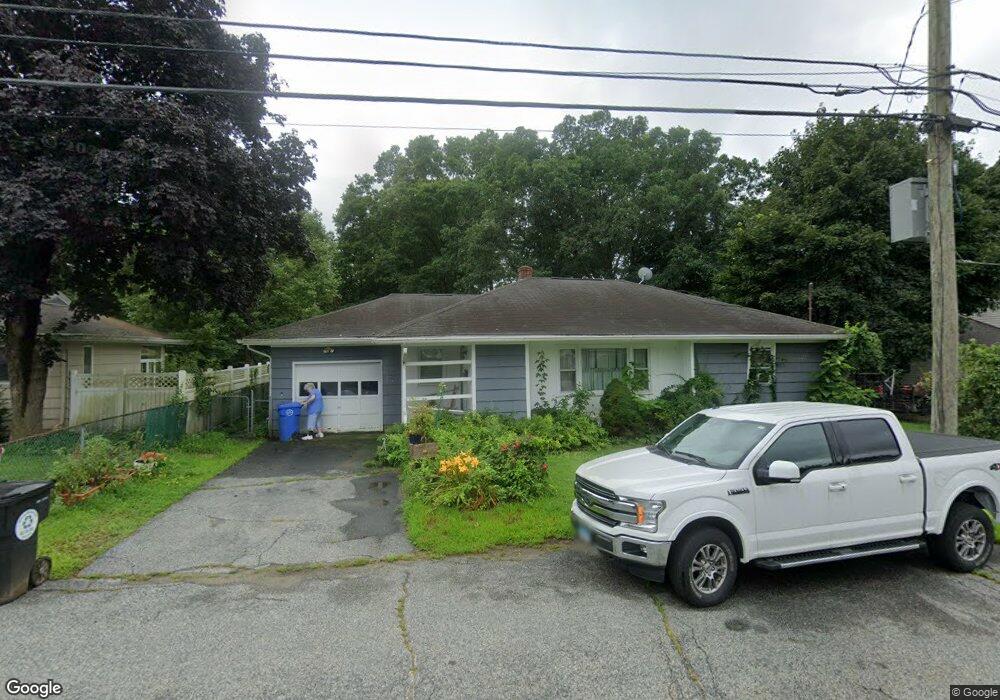
39 Judd Ave Danielson, CT 06239
Estimated Value: $307,169 - $399,000
3
Beds
1
Bath
1,296
Sq Ft
$260/Sq Ft
Est. Value
About This Home
This home is located at 39 Judd Ave, Danielson, CT 06239 and is currently estimated at $336,792, approximately $259 per square foot. 39 Judd Ave is a home located in Windham County with nearby schools including Killingly Central School, Killingly Memorial School, and Killingly Intermediate School.
Ownership History
Date
Name
Owned For
Owner Type
Purchase Details
Closed on
Jul 15, 2005
Sold by
Doughty Henry E and Doughty Ruth C
Bought by
Collins Linda D
Current Estimated Value
Purchase Details
Closed on
Dec 20, 2004
Sold by
Bourdia Joan C
Bought by
Doughty Henry E and Doughty Ruth C
Create a Home Valuation Report for This Property
The Home Valuation Report is an in-depth analysis detailing your home's value as well as a comparison with similar homes in the area
Home Values in the Area
Average Home Value in this Area
Purchase History
| Date | Buyer | Sale Price | Title Company |
|---|---|---|---|
| Collins Linda D | $200,000 | -- | |
| Collins Linda D | $200,000 | -- | |
| Doughty Henry E | $143,000 | -- | |
| Doughty Henry E | $143,000 | -- |
Source: Public Records
Mortgage History
| Date | Status | Borrower | Loan Amount |
|---|---|---|---|
| Open | Doughty Henry E | $158,672 | |
| Closed | Doughty Henry E | $170,000 |
Source: Public Records
Tax History
| Year | Tax Paid | Tax Assessment Tax Assessment Total Assessment is a certain percentage of the fair market value that is determined by local assessors to be the total taxable value of land and additions on the property. | Land | Improvement |
|---|---|---|---|---|
| 2025 | $4,235 | $180,610 | $28,030 | $152,580 |
| 2024 | $3,986 | $180,610 | $28,030 | $152,580 |
| 2023 | $3,321 | $115,920 | $23,100 | $92,820 |
| 2022 | $3,119 | $115,920 | $23,100 | $92,820 |
| 2021 | $3,119 | $115,920 | $23,100 | $92,820 |
| 2020 | $3,053 | $115,920 | $23,100 | $92,820 |
| 2019 | $3,114 | $115,920 | $23,100 | $92,820 |
| 2017 | $2,623 | $89,810 | $14,700 | $75,110 |
| 2016 | $2,614 | $89,810 | $14,700 | $75,110 |
| 2015 | $2,632 | $89,810 | $14,700 | $75,110 |
| 2014 | $2,560 | $89,810 | $14,700 | $75,110 |
Source: Public Records
Map
Nearby Homes
- 48 Athol St Unit 48
- 74 Athol St
- 144 Prospect Ave
- 10 Center St
- 61 Deerwood Dr
- 24 Center St
- 73 Hawkins St
- 133 Maple St
- 14 Valley View Dr
- 16 Valley View Dr
- 102 Cottage St
- 37 Ruth St
- 135 Adelaide St
- 150 Broad St
- 85 Mashentuck Rd
- 724 Cook Hill Rd
- 85 Furnace St
- 37 Katherine Ave
- 11 Kenneth Dr
- 941 Upper Maple St
Your Personal Tour Guide
Ask me questions while you tour the home.