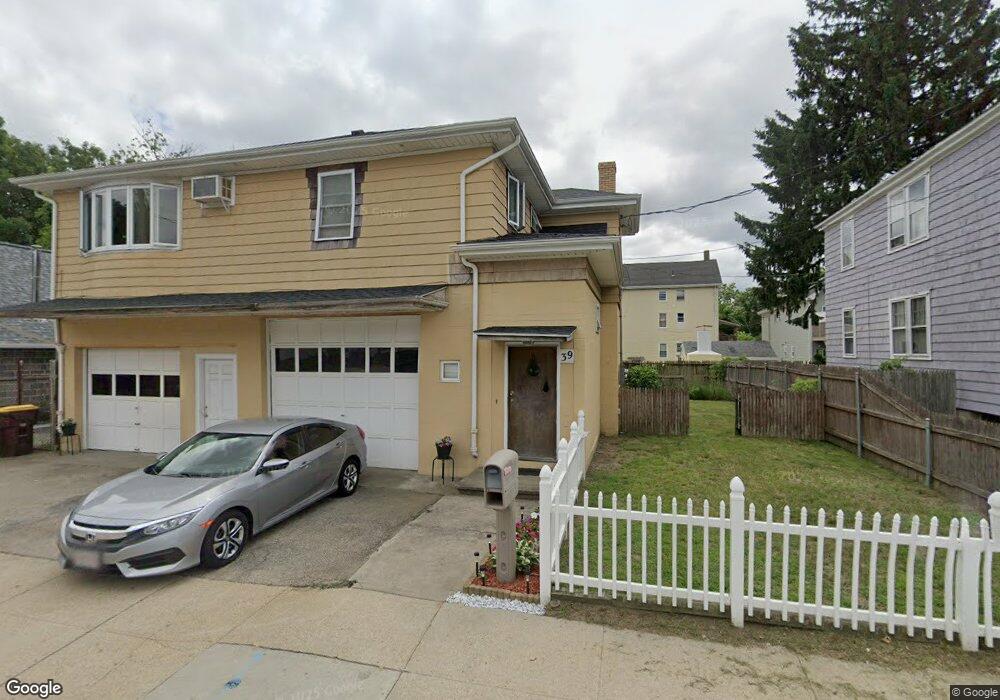
39 Judson St Fall River, MA 02721
Niagara NeighborhoodEstimated Value: $333,000 - $376,000
3
Beds
2
Baths
1,400
Sq Ft
$257/Sq Ft
Est. Value
About This Home
This home is located at 39 Judson St, Fall River, MA 02721 and is currently estimated at $359,612, approximately $256 per square foot. 39 Judson St is a home located in Bristol County with nearby schools including William S Greene, Matthew J. Kuss Middle School, and B M C Durfee High School.
Ownership History
Date
Name
Owned For
Owner Type
Purchase Details
Closed on
Jan 8, 2003
Sold by
Sikora Rudolph and Sikora Patricia
Bought by
Chaves Adelberto T and Chaves Rosa M
Current Estimated Value
Purchase Details
Closed on
Oct 25, 2002
Sold by
Sikora Rudolph and Sikora Patricia
Bought by
Borges David J and Borges Darlene
Home Financials for this Owner
Home Financials are based on the most recent Mortgage that was taken out on this home.
Original Mortgage
$114,360
Interest Rate
6.2%
Mortgage Type
Purchase Money Mortgage
Create a Home Valuation Report for This Property
The Home Valuation Report is an in-depth analysis detailing your home's value as well as a comparison with similar homes in the area
Home Values in the Area
Average Home Value in this Area
Purchase History
| Date | Buyer | Sale Price | Title Company |
|---|---|---|---|
| Chaves Adelberto T | $139,900 | -- | |
| Borges David J | $117,900 | -- | |
| Chaves Adelberto T | $139,900 | -- | |
| Borges David J | $117,900 | -- |
Source: Public Records
Mortgage History
| Date | Status | Borrower | Loan Amount |
|---|---|---|---|
| Previous Owner | Borges David J | $114,360 |
Source: Public Records
Tax History
| Year | Tax Paid | Tax Assessment Tax Assessment Total Assessment is a certain percentage of the fair market value that is determined by local assessors to be the total taxable value of land and additions on the property. | Land | Improvement |
|---|---|---|---|---|
| 2025 | $3,437 | $300,200 | $102,100 | $198,100 |
| 2024 | $3,205 | $278,900 | $95,400 | $183,500 |
| 2023 | $3,056 | $249,100 | $80,000 | $169,100 |
| 2022 | $2,745 | $217,500 | $76,200 | $141,300 |
| 2021 | $2,588 | $187,100 | $72,900 | $114,200 |
| 2020 | $2,513 | $173,900 | $70,500 | $103,400 |
| 2019 | $2,454 | $168,300 | $70,500 | $97,800 |
| 2018 | $2,409 | $164,800 | $74,700 | $90,100 |
| 2017 | $2,285 | $163,200 | $74,700 | $88,500 |
| 2016 | $2,388 | $175,200 | $91,400 | $83,800 |
| 2015 | $2,246 | $171,700 | $87,900 | $83,800 |
| 2014 | $2,282 | $181,400 | $97,600 | $83,800 |
Source: Public Records
Map
Nearby Homes
- 472 Buffinton St (Ns)
- 71 Smith St
- 582 Cambridge St
- 405 Warren St
- 364 Tecumseh St
- 20 Reeves St
- 472 Buffinton St
- 000 Lawrence St
- 1-11 Lawrence St
- 1 Lawrence St Unit 1
- 188-194 Nashua St
- 304 Cambridge St
- 1350 Rodman St
- 21 Boyden St
- 132 Lonsdale St
- 231 Lapham St
- 10 Aberdeen St
- 118 Jefferson St
- 545 Brayton Ave
- 120 Jefferson St
- 41 Judson St
- 49 Judson St
- 29 Judson St
- 61 Judson St
- 30 Judson St
- 44 Judson St
- 522 Buffinton St
- 62 York St
- 50 York St Unit 1 South
- 50 York St Unit 2S
- 50 York St Unit 1S
- 50 York St Unit 1 North
- 50 York St Unit 3N
- 50 York St Unit 2 North
- 50 York St Unit 2 South
- 50 York St Unit 3 North
- 50 York St
- 50 York St Unit 1
- 74 York St
- 0 Baker St
Your Personal Tour Guide
Ask me questions while you tour the home.