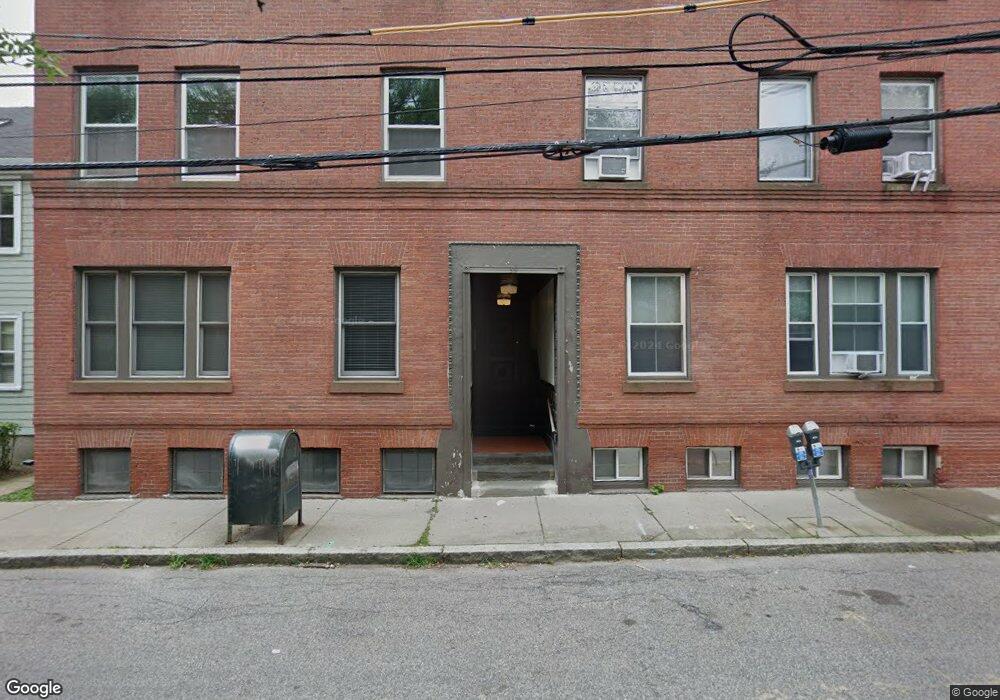
39 Kent St Unit 39-5,39 Brookline, MA 02445
Brookline Village NeighborhoodEstimated Value: $694,000 - $856,000
2
Beds
1
Bath
1,180
Sq Ft
$655/Sq Ft
Est. Value
About This Home
This home is located at 39 Kent St Unit 39-5,39, Brookline, MA 02445 and is currently estimated at $772,368, approximately $654 per square foot. 39 Kent St Unit 39-5,39 is a home located in Norfolk County with nearby schools including Pierce School, St. Mary of the Assumption Elementary School, and Winsor School.
Ownership History
Date
Name
Owned For
Owner Type
Purchase Details
Closed on
Feb 28, 2020
Sold by
Page Benjamin
Bought by
Lindsay Emma M and Lindsay James R
Current Estimated Value
Home Financials for this Owner
Home Financials are based on the most recent Mortgage that was taken out on this home.
Original Mortgage
$565,250
Outstanding Balance
$501,555
Interest Rate
3.6%
Mortgage Type
New Conventional
Estimated Equity
$270,813
Purchase Details
Closed on
Sep 28, 1993
Sold by
Cordeiro Anthony G
Bought by
Page Benjamin
Home Financials for this Owner
Home Financials are based on the most recent Mortgage that was taken out on this home.
Original Mortgage
$94,000
Interest Rate
7.1%
Mortgage Type
Purchase Money Mortgage
Purchase Details
Closed on
Aug 28, 1991
Sold by
Smillie Alan C and Shillie Lynell P
Bought by
Cordeiro Anthony G
Home Financials for this Owner
Home Financials are based on the most recent Mortgage that was taken out on this home.
Original Mortgage
$78,000
Interest Rate
9.44%
Mortgage Type
Purchase Money Mortgage
Create a Home Valuation Report for This Property
The Home Valuation Report is an in-depth analysis detailing your home's value as well as a comparison with similar homes in the area
Home Values in the Area
Average Home Value in this Area
Purchase History
| Date | Buyer | Sale Price | Title Company |
|---|---|---|---|
| Lindsay Emma M | $595,000 | None Available | |
| Page Benjamin | $104,500 | -- | |
| Cordeiro Anthony G | $98,000 | -- |
Source: Public Records
Mortgage History
| Date | Status | Borrower | Loan Amount |
|---|---|---|---|
| Open | Lindsay Emma M | $565,250 | |
| Previous Owner | Cordeiro Anthony G | $94,000 | |
| Previous Owner | Cordeiro Anthony G | $78,000 |
Source: Public Records
Tax History Compared to Growth
Tax History
| Year | Tax Paid | Tax Assessment Tax Assessment Total Assessment is a certain percentage of the fair market value that is determined by local assessors to be the total taxable value of land and additions on the property. | Land | Improvement |
|---|---|---|---|---|
| 2025 | $6,572 | $665,900 | $0 | $665,900 |
| 2024 | $6,378 | $652,800 | $0 | $652,800 |
| 2023 | $6,584 | $660,400 | $0 | $660,400 |
| 2022 | $6,598 | $647,500 | $0 | $647,500 |
| 2021 | $6,283 | $641,100 | $0 | $641,100 |
| 2020 | $5,999 | $634,800 | $0 | $634,800 |
| 2019 | $5,664 | $604,500 | $0 | $604,500 |
| 2018 | $5,483 | $579,600 | $0 | $579,600 |
| 2017 | $5,303 | $536,700 | $0 | $536,700 |
| 2016 | $5,084 | $487,900 | $0 | $487,900 |
| 2015 | $4,737 | $443,500 | $0 | $443,500 |
| 2014 | $4,279 | $375,700 | $0 | $375,700 |
Source: Public Records
Map
Nearby Homes
- 39 Kent St Unit B
- 58 Kent St Unit 302
- 58 Kent St Unit 404
- 58 Kent St Unit 305
- 58 Kent St Unit 303
- 14 Linden St Unit 8
- 44 Washington St Unit 501
- 6 Juniper St Unit 16
- 106 Brook St
- 33 Pond Ave Unit 422
- 33 Pond Ave Unit 709
- 33 Pond Ave Unit 523
- 33 Pond Ave Unit 919
- 120 Brook St Unit 1
- 216 Aspinwall Ave
- 214 Aspinwall Ave Unit 2
- 77 Pond Ave Unit 1103
- 77 Pond Ave Unit 1506
- 390 Riverway Unit 6
- 36 Allerton St
- 33 Kent St Unit 1
- 39 Kent St Unit 8
- 39 Kent St Unit 7
- 39 Kent St Unit 6
- 39 Kent St Unit 5
- 39 Kent St Unit 4
- 39 Kent St Unit 3
- 39 Kent St Unit 2
- 39 Kent St Unit 1
- 33 Kent St Unit 8
- 33 Kent St Unit 7
- 33 Kent St Unit 6
- 33 Kent St Unit 5
- 33 Kent St Unit 4
- 33 Kent St Unit 3
- 33 Kent St Unit 2
- 33 Kent St Unit D
- 33 Kent St Unit 3-a
- 41 Kent St Unit A
- 41 Kent St