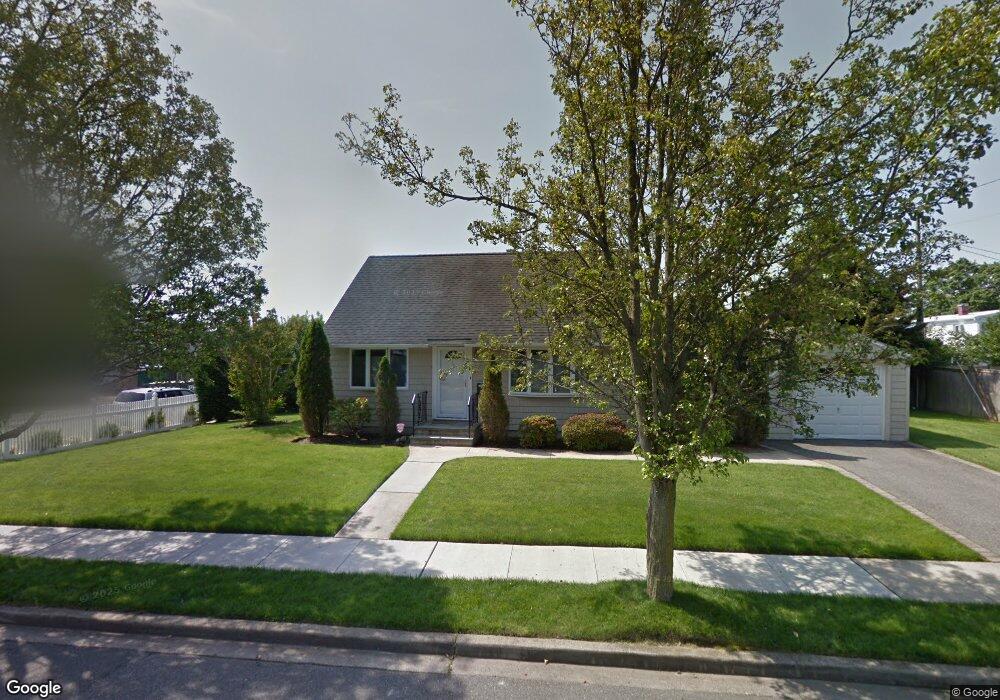
39 Ketcham Ave Hicksville, NY 11801
Estimated Value: $713,840 - $760,000
3
Beds
2
Baths
1,163
Sq Ft
$634/Sq Ft
Est. Value
About This Home
This home is located at 39 Ketcham Ave, Hicksville, NY 11801 and is currently estimated at $736,920, approximately $633 per square foot. 39 Ketcham Ave is a home located in Nassau County with nearby schools including Hicksville Middle School, Hicksville High School, and Our Lady Of Mercy School.
Ownership History
Date
Name
Owned For
Owner Type
Purchase Details
Closed on
May 8, 2018
Sold by
Malandro Daniel A
Bought by
Khanal Shiva P and Thapaliya Yashoda
Current Estimated Value
Home Financials for this Owner
Home Financials are based on the most recent Mortgage that was taken out on this home.
Original Mortgage
$405,600
Outstanding Balance
$349,294
Interest Rate
4.5%
Mortgage Type
New Conventional
Estimated Equity
$387,626
Purchase Details
Closed on
Mar 31, 2010
Sold by
Cerbini Christopher and Cerbini Jaime
Bought by
Malandro Daniel A
Home Financials for this Owner
Home Financials are based on the most recent Mortgage that was taken out on this home.
Original Mortgage
$215,000
Interest Rate
4.37%
Mortgage Type
Purchase Money Mortgage
Purchase Details
Closed on
May 27, 2004
Sold by
Phanithavong Oneta
Bought by
Benisatto Jaime
Create a Home Valuation Report for This Property
The Home Valuation Report is an in-depth analysis detailing your home's value as well as a comparison with similar homes in the area
Home Values in the Area
Average Home Value in this Area
Purchase History
| Date | Buyer | Sale Price | Title Company |
|---|---|---|---|
| Khanal Shiva P | $507,000 | Westcor Land Title Ins Co | |
| Khanal Shiva P | $507,000 | Westcor Land Title Ins Co | |
| Malandro Daniel A | $415,000 | -- | |
| Malandro Daniel A | $415,000 | -- | |
| Benisatto Jaime | $360,000 | -- | |
| Benisatto Jaime | $360,000 | -- |
Source: Public Records
Mortgage History
| Date | Status | Borrower | Loan Amount |
|---|---|---|---|
| Open | Khanal Shiva P | $405,600 | |
| Closed | Khanal Shiva P | $405,600 | |
| Previous Owner | Malandro Daniel A | $215,000 |
Source: Public Records
Tax History Compared to Growth
Tax History
| Year | Tax Paid | Tax Assessment Tax Assessment Total Assessment is a certain percentage of the fair market value that is determined by local assessors to be the total taxable value of land and additions on the property. | Land | Improvement |
|---|---|---|---|---|
| 2025 | $9,784 | $430 | $205 | $225 |
| 2024 | $4,198 | $497 | $237 | $260 |
| 2023 | $10,131 | $497 | $237 | $260 |
| 2022 | $10,131 | $497 | $237 | $260 |
| 2021 | $9,802 | $478 | $228 | $250 |
| 2020 | $9,104 | $574 | $573 | $1 |
| 2019 | $3,088 | $574 | $397 | $177 |
| 2018 | $5,300 | $836 | $0 | $0 |
| 2017 | $5,300 | $836 | $578 | $258 |
| 2016 | $9,421 | $836 | $578 | $258 |
| 2015 | $3,727 | $836 | $578 | $258 |
| 2014 | $3,727 | $836 | $578 | $258 |
| 2013 | $3,400 | $836 | $578 | $258 |
Source: Public Records
Map
Nearby Homes