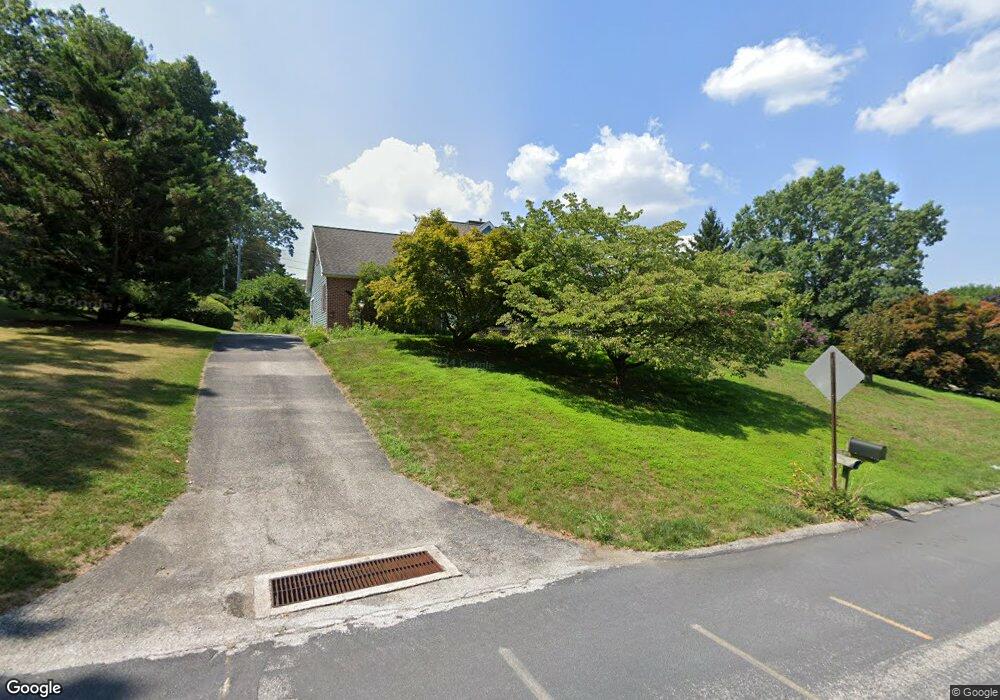
39 Lakeview Cir Hanover, PA 17331
Estimated Value: $349,000 - $426,000
4
Beds
2
Baths
2,584
Sq Ft
$152/Sq Ft
Est. Value
About This Home
This home is located at 39 Lakeview Cir, Hanover, PA 17331 and is currently estimated at $392,100, approximately $151 per square foot. 39 Lakeview Cir is a home located in York County with nearby schools including South Western Senior High School and Hope Christian School Of Hanover.
Ownership History
Date
Name
Owned For
Owner Type
Purchase Details
Closed on
Aug 31, 2001
Sold by
Garrett Richard B and Garrett Lillian S
Bought by
Zinn Kenneth E and Zinn Jan C
Current Estimated Value
Home Financials for this Owner
Home Financials are based on the most recent Mortgage that was taken out on this home.
Original Mortgage
$100,000
Outstanding Balance
$38,995
Interest Rate
6.99%
Estimated Equity
$353,105
Create a Home Valuation Report for This Property
The Home Valuation Report is an in-depth analysis detailing your home's value as well as a comparison with similar homes in the area
Home Values in the Area
Average Home Value in this Area
Purchase History
| Date | Buyer | Sale Price | Title Company |
|---|---|---|---|
| Zinn Kenneth E | $180,000 | -- |
Source: Public Records
Mortgage History
| Date | Status | Borrower | Loan Amount |
|---|---|---|---|
| Open | Zinn Kenneth E | $100,000 |
Source: Public Records
Tax History Compared to Growth
Tax History
| Year | Tax Paid | Tax Assessment Tax Assessment Total Assessment is a certain percentage of the fair market value that is determined by local assessors to be the total taxable value of land and additions on the property. | Land | Improvement |
|---|---|---|---|---|
| 2025 | $6,262 | $187,480 | $43,610 | $143,870 |
| 2024 | $6,262 | $187,480 | $43,610 | $143,870 |
| 2023 | $6,149 | $187,480 | $43,610 | $143,870 |
| 2022 | $6,054 | $187,480 | $43,610 | $143,870 |
| 2021 | $5,778 | $187,480 | $43,610 | $143,870 |
| 2020 | $5,778 | $187,480 | $43,610 | $143,870 |
| 2019 | $5,668 | $187,480 | $43,610 | $143,870 |
| 2018 | $5,574 | $187,480 | $43,610 | $143,870 |
| 2017 | $5,465 | $187,480 | $43,610 | $143,870 |
| 2016 | $0 | $187,480 | $43,610 | $143,870 |
| 2015 | -- | $187,480 | $43,610 | $143,870 |
| 2014 | -- | $187,480 | $43,610 | $143,870 |
Source: Public Records
Map
Nearby Homes
- 8 Lakeview Terrace
- 1753 Black Rock Rd
- 49 Valley View Dr
- 312 Homestead Dr
- 545 Ripple Dr Unit 66
- Homesite 312 Homestead Dr
- 47 Holstein Dr
- 151 Homestead Dr
- 111 Homestead Dr
- 295 Homestead Dr
- 153 Holstein Dr
- 110 Sara Ln
- 62 Allen Dr
- 117 Holstein Dr Unit 164
- 119 Holstein Dr Unit 163
- 123 Holstein Dr Unit 161
- 125 Holstein Dr Unit 160
- 1270 Wanda Dr
- 279 Ridgeview Ln Unit 49
- 276 Ridgeview Ln Unit 46
- 80 Lakeview Terrace
- 19 Lakeview Cir
- 59 Lakeview Cir
- 32 Lakeview Cir
- 70 Lakeview Terrace
- 88 Lakeview Terrace
- 7 Lakeview Cir
- 66 Lakeview Cir
- 99 Lakeview Terrace
- 48 Lakeview Terrace
- 87 Lakeview Terrace
- 79 Lakeview Cir
- 73 Lakeview Terrace
- 17 Lakeview Terrace
- 67 Lakeview Terrace
- 120 Lindsay Ln
- 84 Lakeview Cir
- 63 Lakeview Terrace
- 63 Lakeview Terrace
- 100 Lindsay Ln