39 Lancaster Rd Shirley, MA 01464
Estimated Value: $553,000 - $623,000
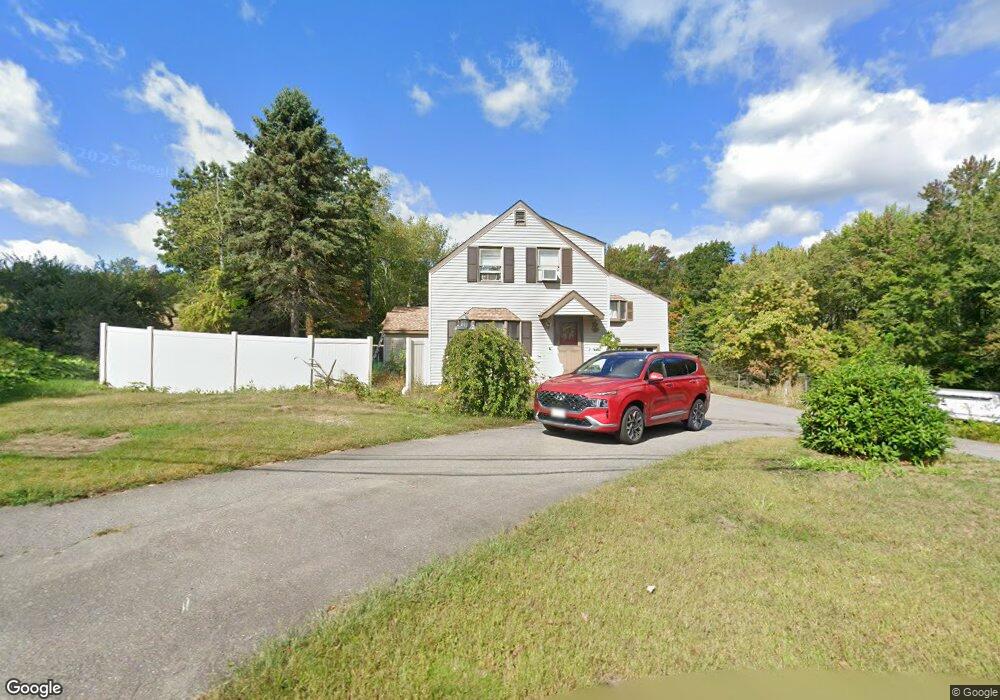
About This Home
This home is located at 39 Lancaster Rd, Shirley, MA 01464 and is currently estimated at $587,662, approximately $229 per square foot. 39 Lancaster Rd is a home located in Middlesex County with nearby schools including Page Hilltop School, Lura A. White Elementary School, and Ayer Shirley Regional Middle School.
Ownership History
We collect this data history from publicly available records. To have your information removed, we recommend requesting removal directly through your county’s website.
Purchase Details
Home Values in the Area
Average Home Value in this Area
Purchase History
We collect this data history from publicly available records. To have your information removed, we recommend requesting removal directly through your county’s website.
| Date | Buyer | Sale Price | Title Company |
|---|---|---|---|
| -- | -- |
Mortgage History
We collect this data history from publicly available records. To have your information removed, we recommend requesting removal directly through your county’s website.
| Date | Status | Borrower | Loan Amount |
|---|---|---|---|
| Open | $145,000 | ||
| Closed | $135,000 |
Tax History
We collect this data history from publicly available records. To have your information removed, we recommend requesting removal directly through your county’s website.
| Year | Tax Paid | Tax Assessment Tax Assessment Total Assessment is a certain percentage of the fair market value that is determined by local assessors to be the total taxable value of land and additions on the property. | Land | Improvement |
|---|---|---|---|---|
| 2025 | $65 | $499,300 | $135,200 | $364,100 |
| 2024 | $6,467 | $476,600 | $123,200 | $353,400 |
| 2023 | $5,933 | $418,400 | $123,200 | $295,200 |
| 2022 | $6,091 | $393,500 | $115,300 | $278,200 |
| 2021 | $13,088 | $357,300 | $103,400 | $253,900 |
| 2020 | $5,513 | $342,200 | $103,400 | $238,800 |
| 2019 | $11,939 | $336,200 | $103,400 | $232,800 |
| 2018 | $5,284 | $321,800 | $97,000 | $224,800 |
| 2017 | $5,356 | $324,200 | $99,400 | $224,800 |
| 2016 | $4,755 | $288,000 | $99,400 | $188,600 |
| 2015 | $4,570 | $264,000 | $87,500 | $176,500 |
Map
- 16 Windsor Rd
- 61 Harvard Rd
- 38 Fredonian St
- 0 Windsor Rd
- 22 Porter St
- 3 Catacunemaug Rd
- 30 Chapel St
- 8 Benjamin Rd
- 60 Chapel St
- 32 Bemis Way Unit 32
- 37 Bemis Way Unit 37
- 21 Ambrose Way Unit 21
- 14 Ambrose Way Unit 14
- 4 Ambrose Way Unit 4
- 176 Robbs Hill Rd
- 148 Kaleva Rd
- 12 Meditation Ln Unit 10B
- 138 Benjamin Rd
- 35 Patterson Rd
- 5 Powell St Unit B
Ask me questions while you tour the home.