T
Landlord's Agent in 2023
Tankika Ford
Progress Residential PropertyManager
Estimated Value: $374,893
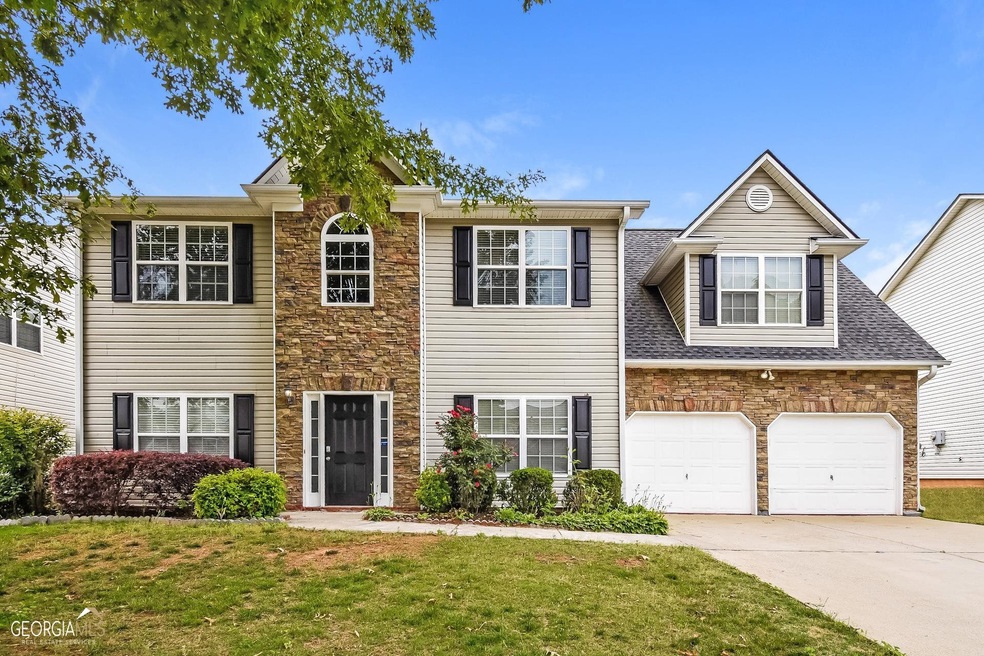
Interested in this home? You clearly have exceptional taste. Like all our homes, this one features: a great location in a desirable neighborhood, a comfortable layout with good-sized bedrooms and bathrooms, a great kitchen with plenty of counter and cabinet space, many updated and upgraded features, central HVAC and programmable thermostat, garage and a spacious yard, and it's pet friendly.
Last Agent to Rent the Property
Tankika Ford
Progress Residential PropertyManager License #334101 Listed on: 05/24/2023
Last Renter's Agent
Tankika Ford
Progress Residential PropertyManager License #334101 Listed on: 05/24/2023
| Date | Buyer | Sale Price | Title Company |
|---|---|---|---|
| Residential Home Buyer Atlanta Llc | $1,648,218 | -- | |
| Chapman John G | -- | -- | |
| -- | -- | -- | |
| -- | -- | -- | |
| Chapman John G | -- | -- | |
| Chapman John | $194,000 | -- | |
| -- | $194,000 | -- | |
| -- | $50,000 | -- | |
| -- | $42,000 | -- |
| Date | Status | Borrower | Loan Amount |
|---|---|---|---|
| Open | Residential Home Buyer Atlanta Llc | $343,541 | |
| Previous Owner | -- | $192,400 |
| Date | Event | Price | List to Sale | Price per Sq Ft | Prior Sale |
|---|---|---|---|---|---|
| 06/09/2023 06/09/23 | Rented | $2,515 | 0.0% | -- | |
| 05/24/2023 05/24/23 | For Rent | $2,515 | 0.0% | -- | |
| 04/11/2023 04/11/23 | Sold | $338,564 | 0.0% | $112 / Sq Ft | View Prior Sale |
| 02/27/2023 02/27/23 | Pending | -- | -- | -- | |
| 02/14/2023 02/14/23 | Off Market | $338,564 | -- | -- | |
| 02/02/2023 02/02/23 | Price Changed | $354,000 | -0.3% | $117 / Sq Ft | |
| 01/12/2023 01/12/23 | Price Changed | $355,000 | -5.6% | $117 / Sq Ft | |
| 11/10/2022 11/10/22 | Price Changed | $376,000 | -1.3% | $124 / Sq Ft | |
| 10/20/2022 10/20/22 | Price Changed | $381,000 | -2.8% | $126 / Sq Ft | |
| 09/19/2022 09/19/22 | For Sale | $392,000 | -- | $130 / Sq Ft |
| Year | Tax Paid | Tax Assessment Tax Assessment Total Assessment is a certain percentage of the fair market value that is determined by local assessors to be the total taxable value of land and additions on the property. | Land | Improvement |
|---|---|---|---|---|
| 2025 | $3,291 | $132,288 | $16,000 | $116,288 |
| 2024 | $3,255 | $145,056 | $16,000 | $129,056 |
| 2023 | $3,808 | $151,452 | $16,000 | $135,452 |
| 2022 | $1,043 | $129,320 | $12,000 | $117,320 |
| 2021 | $931 | $94,272 | $12,000 | $82,272 |
| 2020 | $899 | $86,120 | $12,000 | $74,120 |
| 2019 | $933 | $85,960 | $12,000 | $73,960 |
| 2018 | $778 | $73,160 | $8,000 | $65,160 |
| 2017 | $663 | $60,792 | $8,000 | $52,792 |
| 2016 | $664 | $62,480 | $8,000 | $54,480 |
| 2015 | $695 | $62,680 | $8,000 | $54,680 |
| 2014 | $628 | $53,920 | $8,000 | $45,920 |
| 2013 | -- | $43,600 | $8,000 | $35,600 |
T
Landlord's Agent in 2023
Tankika Ford
Progress Residential PropertyManager
K
Seller's Agent in 2023
Kadie Stidham
Mark Spain
S
Seller Co-Listing Agent in 2023
Shannon Taylor
Trend Atlanta Realty, Inc.
N
Buyer's Agent in 2023
No Sales Agent
Non-Mls Company
Source: Georgia MLS
MLS Number: 20124248
APN: 181.2.1.044.0000
Disclaimer: Certain information contained herein is derived from information provided by parties other than Homes.com. All information provided is deemed reliable, but is not guaranteed to be accurate and should be independently verified.
![]() The data relating to real estate for sale on this web site comes in part from the Broker Reciprocity Program of Georgia MLS. Real estate listings held by brokerage firms other than Redfin are marked with the Broker Reciprocity logo and detailed information about them includes the name of the listing brokers. Information deemed reliable but not guaranteed. Copyright 2026 Georgia MLS. All rights reserved.
The data relating to real estate for sale on this web site comes in part from the Broker Reciprocity Program of Georgia MLS. Real estate listings held by brokerage firms other than Redfin are marked with the Broker Reciprocity logo and detailed information about them includes the name of the listing brokers. Information deemed reliable but not guaranteed. Copyright 2026 Georgia MLS. All rights reserved.
Ask me questions while you tour the home.
