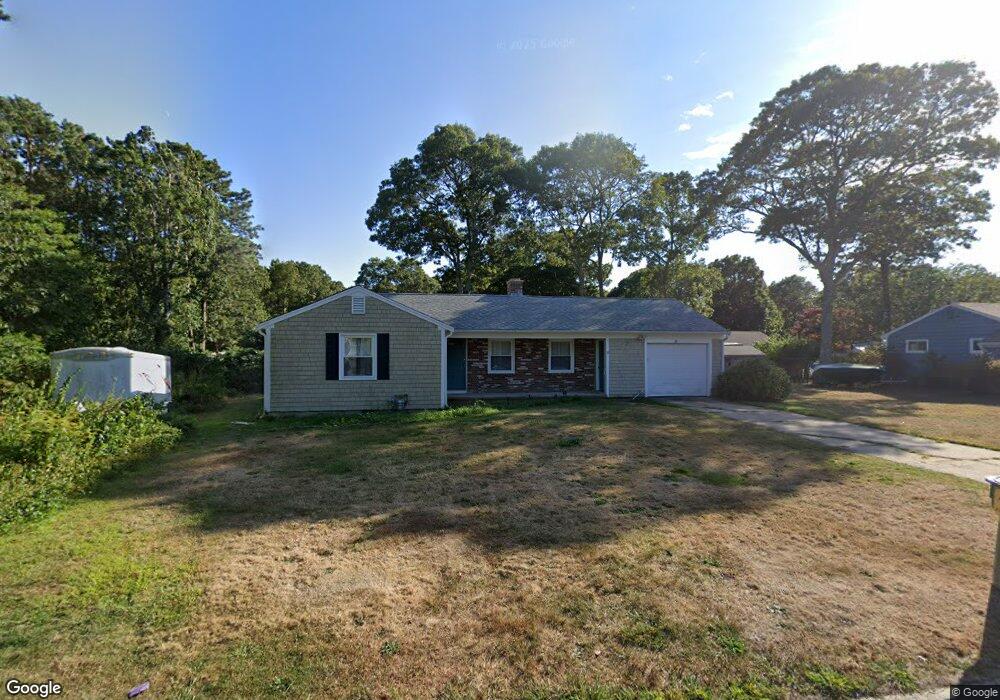
39 Leonard Rd Hyannis, MA 02601
Estimated Value: $489,000 - $565,000
2
Beds
2
Baths
1,001
Sq Ft
$528/Sq Ft
Est. Value
About This Home
This home is located at 39 Leonard Rd, Hyannis, MA 02601 and is currently estimated at $528,099, approximately $527 per square foot. 39 Leonard Rd is a home located in Barnstable County with nearby schools including Hyannis West Elementary School, Barnstable United Elementary School, and Barnstable Intermediate School.
Ownership History
Date
Name
Owned For
Owner Type
Purchase Details
Closed on
Oct 7, 2005
Sold by
Bartlett Donald and Bartlett Sandra
Bought by
Stepanishen Kristine
Current Estimated Value
Home Financials for this Owner
Home Financials are based on the most recent Mortgage that was taken out on this home.
Original Mortgage
$247,200
Outstanding Balance
$132,729
Interest Rate
5.81%
Mortgage Type
Purchase Money Mortgage
Estimated Equity
$395,370
Purchase Details
Closed on
Apr 8, 2002
Sold by
Fitzgerald Kirk M
Bought by
Bartlett Donald
Home Financials for this Owner
Home Financials are based on the most recent Mortgage that was taken out on this home.
Original Mortgage
$151,600
Interest Rate
6.85%
Mortgage Type
Purchase Money Mortgage
Purchase Details
Closed on
Jun 27, 2000
Sold by
Anderson Robert E and Anderson Janette B
Bought by
Fitzgerald Kirk
Create a Home Valuation Report for This Property
The Home Valuation Report is an in-depth analysis detailing your home's value as well as a comparison with similar homes in the area
Home Values in the Area
Average Home Value in this Area
Purchase History
| Date | Buyer | Sale Price | Title Company |
|---|---|---|---|
| Stepanishen Kristine | $309,000 | -- | |
| Bartlett Donald | $189,500 | -- | |
| Fitzgerald Kirk | $133,000 | -- |
Source: Public Records
Mortgage History
| Date | Status | Borrower | Loan Amount |
|---|---|---|---|
| Open | Stepanishen Kristine | $247,200 | |
| Closed | Stepanishen Kristine | $33,600 | |
| Previous Owner | Fitzgerald Kirk | $37,700 | |
| Previous Owner | Fitzgerald Kirk | $151,600 | |
| Previous Owner | Fitzgerald Kirk | $128,000 |
Source: Public Records
Tax History Compared to Growth
Tax History
| Year | Tax Paid | Tax Assessment Tax Assessment Total Assessment is a certain percentage of the fair market value that is determined by local assessors to be the total taxable value of land and additions on the property. | Land | Improvement |
|---|---|---|---|---|
| 2025 | $3,774 | $407,100 | $146,700 | $260,400 |
| 2024 | $3,635 | $401,700 | $146,700 | $255,000 |
| 2023 | $3,380 | $353,200 | $133,300 | $219,900 |
| 2022 | $3,373 | $291,500 | $98,800 | $192,700 |
| 2021 | $3,073 | $258,000 | $98,800 | $159,200 |
| 2020 | $3,079 | $249,700 | $98,800 | $150,900 |
| 2019 | $2,911 | $231,400 | $98,800 | $132,600 |
| 2018 | $2,664 | $216,600 | $104,000 | $112,600 |
| 2017 | $2,526 | $210,700 | $104,000 | $106,700 |
| 2016 | $2,493 | $212,500 | $105,800 | $106,700 |
| 2015 | $2,365 | $204,400 | $100,900 | $103,500 |
Source: Public Records
Map
Nearby Homes