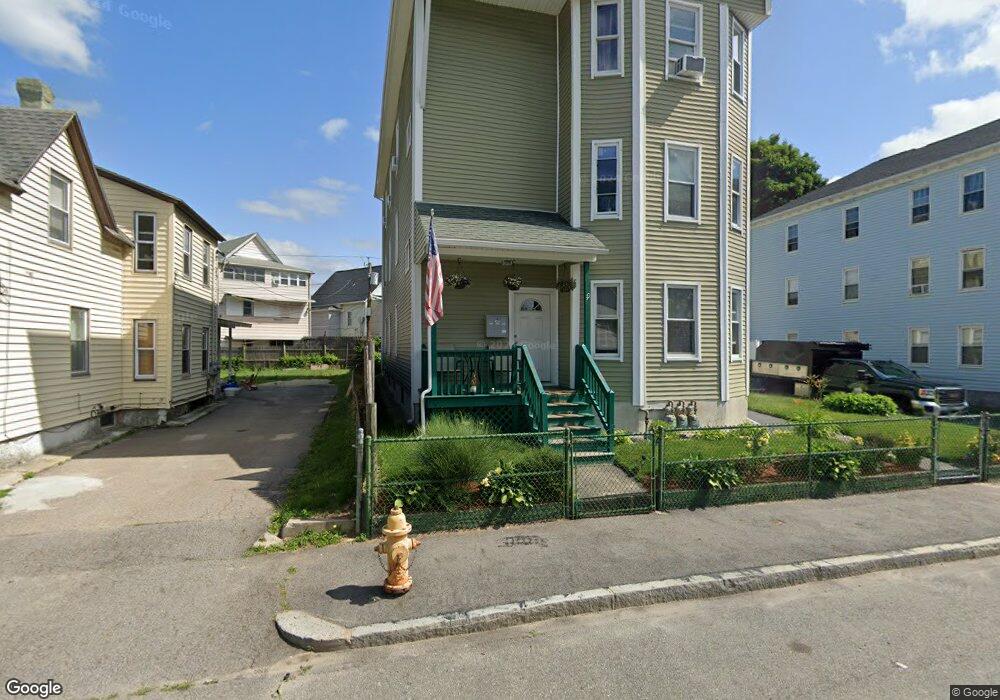
39 Litchfield St Worcester, MA 01603
Main South NeighborhoodEstimated Value: $731,000 - $965,000
9
Beds
3
Baths
3,433
Sq Ft
$239/Sq Ft
Est. Value
About This Home
This home is located at 39 Litchfield St, Worcester, MA 01603 and is currently estimated at $821,000, approximately $239 per square foot. 39 Litchfield St is a home located in Worcester County with nearby schools including Jacob Hiatt Magnet School, Chandler Magnet, and University Park Campus School.
Ownership History
Date
Name
Owned For
Owner Type
Purchase Details
Closed on
Jun 1, 1998
Sold by
Hawkesworth Susan L
Bought by
Bryan Maritza
Current Estimated Value
Home Financials for this Owner
Home Financials are based on the most recent Mortgage that was taken out on this home.
Original Mortgage
$72,800
Outstanding Balance
$14,653
Interest Rate
7.12%
Mortgage Type
Purchase Money Mortgage
Estimated Equity
$806,347
Create a Home Valuation Report for This Property
The Home Valuation Report is an in-depth analysis detailing your home's value as well as a comparison with similar homes in the area
Home Values in the Area
Average Home Value in this Area
Purchase History
We collect this data history from publicly available records. To have your information removed, we recommend requesting removal directly through your county’s website.
| Date | Buyer | Sale Price | Title Company |
|---|---|---|---|
| Bryan Maritza | $91,000 | -- |
Source: Public Records
Mortgage History
We collect this data history from publicly available records. To have your information removed, we recommend requesting removal directly through your county’s website.
| Date | Status | Borrower | Loan Amount |
|---|---|---|---|
| Open | Bryan Maritza | $72,800 |
Source: Public Records
Tax History
| Year | Tax Paid | Tax Assessment Tax Assessment Total Assessment is a certain percentage of the fair market value that is determined by local assessors to be the total taxable value of land and additions on the property. | Land | Improvement |
|---|---|---|---|---|
| 2025 | $11,317 | $858,000 | $60,600 | $797,400 |
| 2024 | $10,328 | $751,100 | $60,600 | $690,500 |
| 2023 | $9,886 | $689,400 | $47,900 | $641,500 |
| 2022 | $8,647 | $568,500 | $38,300 | $530,200 |
| 2021 | $8,457 | $519,500 | $30,600 | $488,900 |
| 2020 | $7,744 | $455,500 | $30,600 | $424,900 |
| 2019 | $6,239 | $346,600 | $29,200 | $317,400 |
| 2018 | $6,053 | $320,100 | $29,200 | $290,900 |
| 2017 | $5,624 | $292,600 | $29,200 | $263,400 |
| 2016 | $3,667 | $177,900 | $20,700 | $157,200 |
| 2015 | $4,217 | $210,100 | $20,700 | $189,400 |
| 2014 | $4,105 | $210,100 | $20,700 | $189,400 |
Source: Public Records
Map
Nearby Homes
- 145 Canterbury St
- 21 Illinois St Unit 202
- 54 Richards St
- 160 Fremont St Unit 317
- 160 Fremont St Unit 310
- 155 Grand St
- 83 Canterbury St
- 3 Chelsea St
- 5 Freeland Terrace
- 1022 Main St
- 29 Cambridge St
- 1038 Main St
- 549 Cambridge St
- 200 Beacon St
- 5 Claremont St
- 71 Maywood St
- 38 Oberlin St
- 212 Dewey St
- 817 Main St
- 40 Hollywood St
- 30 Litchfield St
- 28 Litchfield St
- 32 Litchfield St
- 26 Litchfield St
- 265 Cambridge St
- 34 Litchfield St
- 259+265 Cambridge
- 271 Cambridge St
- 259 Cambridge St
- 273 Cambridge St
- 33 Litchfield St
- 253 Cambridge St
- 126 Southgate St
- 35 Litchfield St
- 35 Litchfield St Unit 3
- 35 Litchfield St Unit 2
- 36 Litchfield St
- 27 Litchfield St
- 37 Litchfield St
- 25 Litchfield St
Your Personal Tour Guide
Ask me questions while you tour the home.