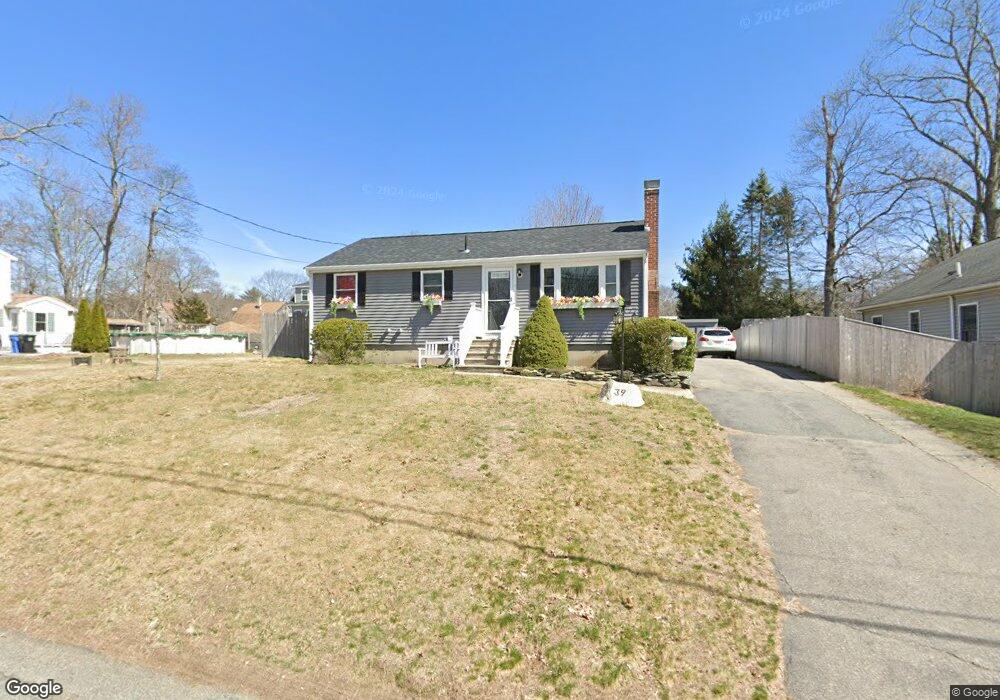
39 Loring Ave Whitman, MA 02382
Estimated Value: $429,000 - $480,000
3
Beds
2
Baths
888
Sq Ft
$504/Sq Ft
Est. Value
About This Home
This home is located at 39 Loring Ave, Whitman, MA 02382 and is currently estimated at $447,270, approximately $503 per square foot. 39 Loring Ave is a home located in Plymouth County with nearby schools including Trinity Catholic Academy and Cardinal Spellman High School.
Ownership History
Date
Name
Owned For
Owner Type
Purchase Details
Closed on
Aug 23, 2012
Sold by
Thompson Tracey and Enos Donald
Bought by
Enos Donald and Thompson-Enos Tracey
Current Estimated Value
Home Financials for this Owner
Home Financials are based on the most recent Mortgage that was taken out on this home.
Original Mortgage
$166,056
Outstanding Balance
$114,711
Interest Rate
3.61%
Mortgage Type
New Conventional
Estimated Equity
$332,559
Purchase Details
Closed on
May 4, 2009
Sold by
Light Ernest R
Bought by
Thompson Tracey and Enos Donald
Home Financials for this Owner
Home Financials are based on the most recent Mortgage that was taken out on this home.
Original Mortgage
$142,373
Interest Rate
4.86%
Mortgage Type
Purchase Money Mortgage
Purchase Details
Closed on
Nov 1, 2004
Sold by
Arnold Dorothy
Bought by
Light Ernest R
Home Financials for this Owner
Home Financials are based on the most recent Mortgage that was taken out on this home.
Original Mortgage
$242,725
Interest Rate
5.74%
Mortgage Type
Purchase Money Mortgage
Create a Home Valuation Report for This Property
The Home Valuation Report is an in-depth analysis detailing your home's value as well as a comparison with similar homes in the area
Home Values in the Area
Average Home Value in this Area
Purchase History
| Date | Buyer | Sale Price | Title Company |
|---|---|---|---|
| Enos Donald | -- | -- | |
| Thompson Tracey | $145,000 | -- | |
| Light Ernest R | $255,500 | -- |
Source: Public Records
Mortgage History
| Date | Status | Borrower | Loan Amount |
|---|---|---|---|
| Open | Enos Donald | $166,056 | |
| Previous Owner | Light Ernest R | $142,373 | |
| Previous Owner | Light Ernest R | $277,200 | |
| Previous Owner | Light Ernest R | $242,725 | |
| Previous Owner | Light Ernest R | $160,000 |
Source: Public Records
Tax History
| Year | Tax Paid | Tax Assessment Tax Assessment Total Assessment is a certain percentage of the fair market value that is determined by local assessors to be the total taxable value of land and additions on the property. | Land | Improvement |
|---|---|---|---|---|
| 2025 | $5,119 | $390,200 | $200,000 | $190,200 |
| 2024 | $4,798 | $376,600 | $196,100 | $180,500 |
| 2023 | $4,577 | $337,300 | $170,000 | $167,300 |
| 2022 | $4,463 | $306,500 | $154,600 | $151,900 |
| 2021 | $3,911 | $252,300 | $128,500 | $123,800 |
| 2020 | $3,882 | $244,900 | $128,500 | $116,400 |
| 2019 | $3,634 | $236,300 | $128,500 | $107,800 |
| 2018 | $3,505 | $218,900 | $121,700 | $97,200 |
| 2017 | $3,301 | $218,900 | $121,700 | $97,200 |
| 2016 | $3,216 | $206,300 | $120,700 | $85,600 |
| 2015 | $2,996 | $191,900 | $106,300 | $85,600 |
Source: Public Records
Map
Nearby Homes
Your Personal Tour Guide
Ask me questions while you tour the home.