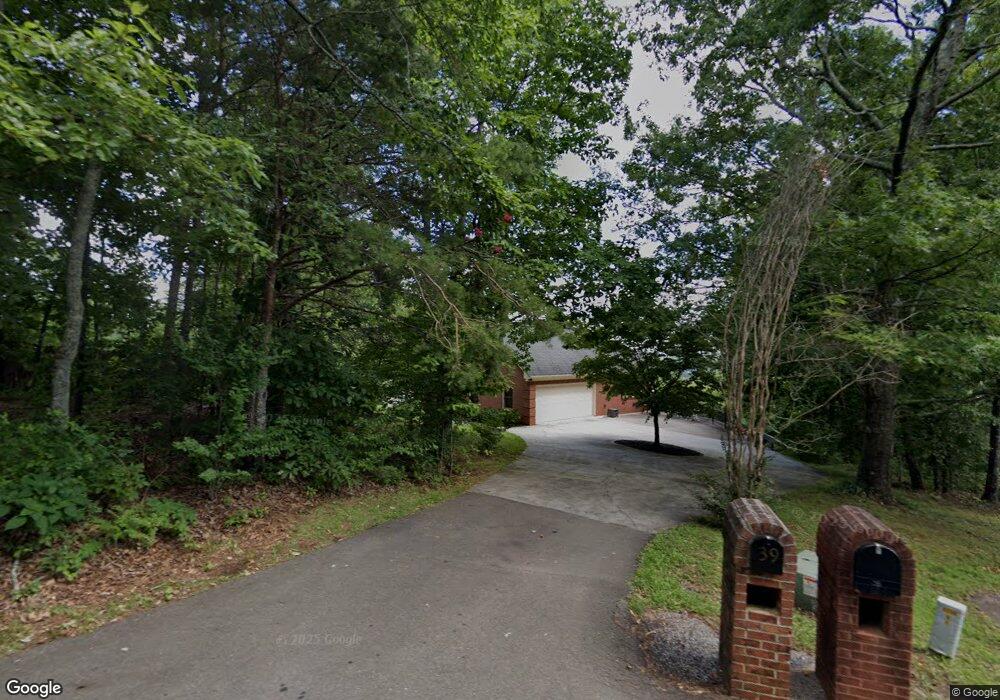
39 Luger Ln Jasper, FL 30143
Estimated Value: $512,810 - $584,000
Studio
3
Baths
1,707
Sq Ft
$316/Sq Ft
Est. Value
About This Home
This home is located at 39 Luger Ln, Jasper, FL 30143 and is currently estimated at $540,203, approximately $316 per square foot. 39 Luger Ln is a home located in Pickens County with nearby schools including Tate Elementary School, Pickens County Middle School, and Pickens County High School.
Ownership History
Date
Name
Owned For
Owner Type
Purchase Details
Closed on
Oct 14, 2022
Sold by
Davenport Joyce H
Bought by
Denney Patricia H and Denney Johnny G
Current Estimated Value
Home Financials for this Owner
Home Financials are based on the most recent Mortgage that was taken out on this home.
Original Mortgage
$383,200
Outstanding Balance
$367,335
Interest Rate
6.02%
Mortgage Type
New Conventional
Estimated Equity
$172,868
Purchase Details
Closed on
Jan 15, 2013
Sold by
Salmond Joyce F
Bought by
Davenport William K and Davenport Joyce H
Home Financials for this Owner
Home Financials are based on the most recent Mortgage that was taken out on this home.
Original Mortgage
$149,850
Interest Rate
3.39%
Mortgage Type
New Conventional
Purchase Details
Closed on
Mar 29, 2012
Sold by
Salmond Burwell B
Bought by
Salmond Joyce F
Purchase Details
Closed on
Sep 15, 1992
Sold by
Wigington Properties Inc
Bought by
Salmond Burwell B
Create a Home Valuation Report for This Property
The Home Valuation Report is an in-depth analysis detailing your home's value as well as a comparison with similar homes in the area
Home Values in the Area
Average Home Value in this Area
Purchase History
| Date | Buyer | Sale Price | Title Company |
|---|---|---|---|
| Denney Patricia H | $479,000 | -- | |
| Davenport William K | $166,500 | -- | |
| Salmond Joyce F | -- | -- | |
| Salmond Burwell B | $15,700 | -- |
Source: Public Records
Mortgage History
| Date | Status | Borrower | Loan Amount |
|---|---|---|---|
| Open | Denney Patricia H | $383,200 | |
| Previous Owner | Davenport William K | $149,850 |
Source: Public Records
Tax History
| Year | Tax Paid | Tax Assessment Tax Assessment Total Assessment is a certain percentage of the fair market value that is determined by local assessors to be the total taxable value of land and additions on the property. | Land | Improvement |
|---|---|---|---|---|
| 2025 | $3,340 | $189,410 | $19,200 | $170,210 |
| 2024 | $3,649 | $189,410 | $19,200 | $170,210 |
| 2023 | $3,852 | $189,410 | $19,200 | $170,210 |
| 2022 | $2,004 | $103,542 | $12,000 | $91,542 |
| 2021 | $1,385 | $68,571 | $12,000 | $56,571 |
| 2020 | $1,427 | $68,571 | $12,000 | $56,571 |
| 2019 | $1,460 | $68,571 | $12,000 | $56,571 |
| 2018 | $1,473 | $68,571 | $12,000 | $56,571 |
| 2017 | $1,497 | $68,571 | $12,000 | $56,571 |
| 2016 | $1,521 | $68,571 | $12,000 | $56,571 |
| 2015 | $1,486 | $68,571 | $12,000 | $56,571 |
| 2014 | $1,489 | $68,571 | $12,000 | $56,571 |
| 2013 | -- | $68,570 | $12,000 | $56,570 |
Source: Public Records
Map
Nearby Homes
- 800 Browning Way
- 850 Browning Way
- 85 Mauser Ct
- 76 Remington Ln
- 164 Mossburg Trail
- 91 Smith and Wesson Way
- Lot 178 Vista Creek Dr
- Lot 178 Vista Creek Dr Unit 178
- 0 Mauser Ct Unit 10667385
- 0 Mauser Ct Unit 7715064
- 0 Mauser Ct Unit 10686076
- 0 Mauser Ct Unit 7700325
- 173 Hood Park Ct
- 710 Lumber Company Rd
- 28 Hood Park Ct
- 0 Redfield Way Unit 7714926
- 0 Orchard Rd Unit 10643331
- 0 Orchard Rd Unit 7681112
- 71 Hood Park Ct
- 65 Hood Park Ct
- 39 Luger Ln Unit 83
- 39 Luger Ln
- 168 Hunters Ridge
- 15 Luger Ln
- 38 Luger Ln
- 272 Hunters Ridge
- 241 Hunters Ridge
- 0 Redfield 219 Way Unit LOT 219 10279044
- 0 Redfield 219 Way
- 0 Redfield Way Lot 223 Unit 7096374
- 0 Redfield Way Lot 223
- 219 Redfield Way
- 215 Redfield Way
- 214 Redfield Way
- 45 Redfield Way
- 1003 Hunters Ridge Unit 9037
- 1003 Hunters Ridge
- 993 Hunters Ridge
- 263 Redfield Way
- 261 Redfield Way
Your Personal Tour Guide
Ask me questions while you tour the home.