NOT LISTED FOR SALE

Estimated Value: $806,000 - $878,000

2 Beds
1 Bath
1,028 Sq Ft
$831/Sq Ft Est. Value

About This Home

Live under the 02138 Cambridge canopy on this lovely tree lined street. Located on picturesque Magnolia Avenue. Nestled between Inman Square, Kirkland Village and Harvard Square. Only 1 block to to famous world famous Savenor's; Julia Childs' favorite neighborhod market featured in her historied cooking show. Boast an 89 walk score. Convenient to Central Square and MIT as well. 
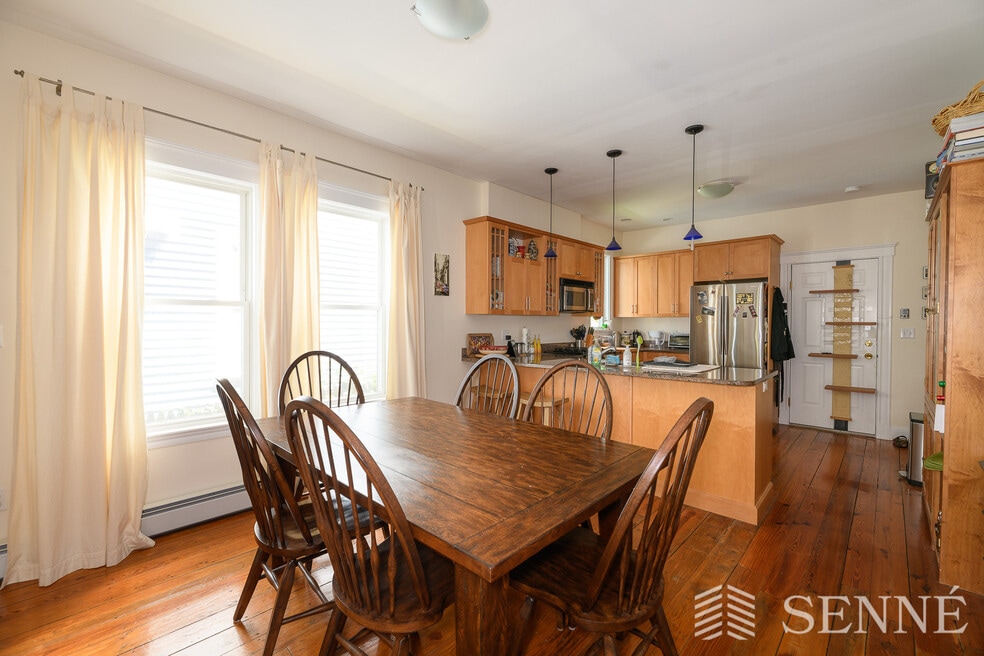
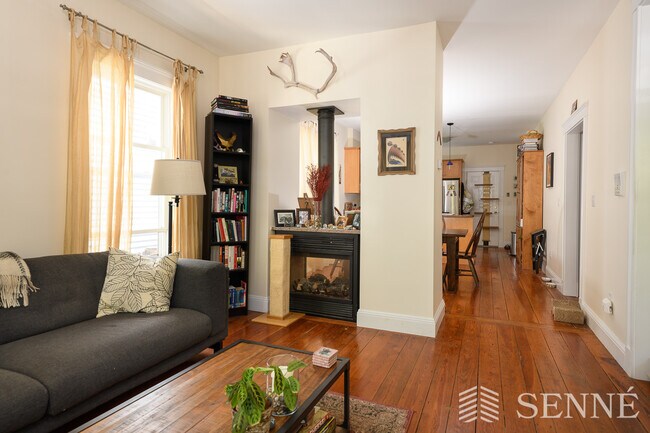
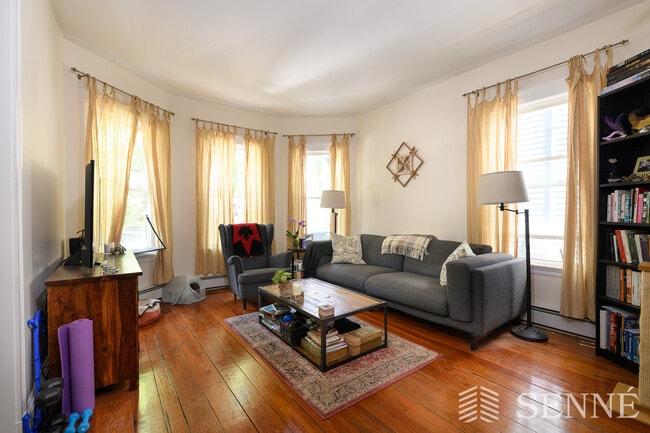
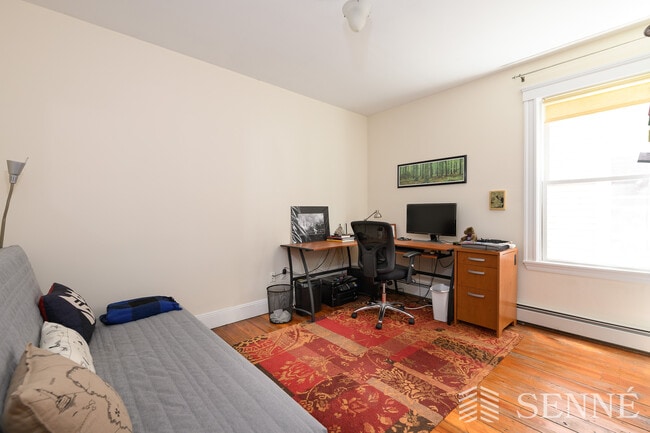
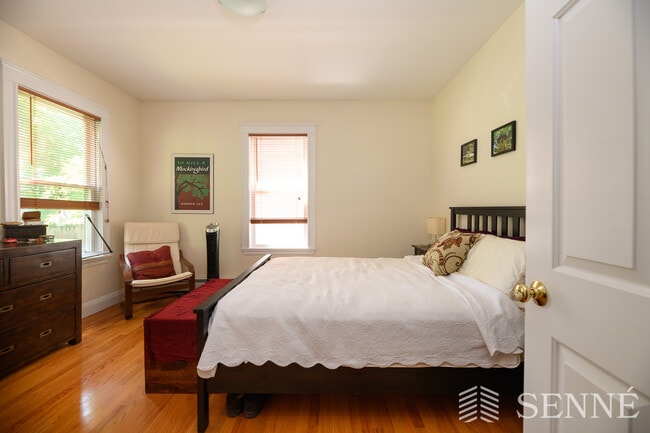
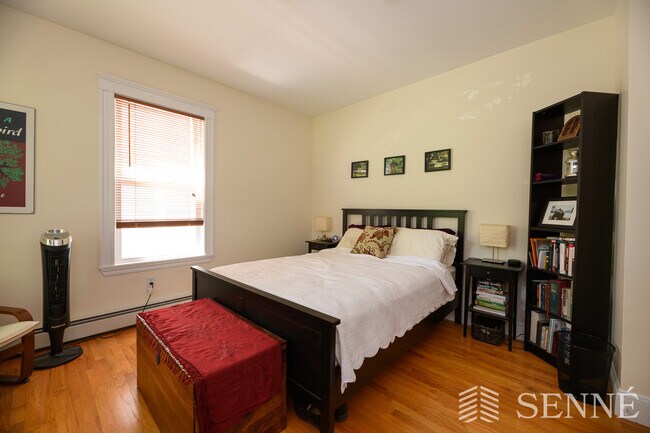
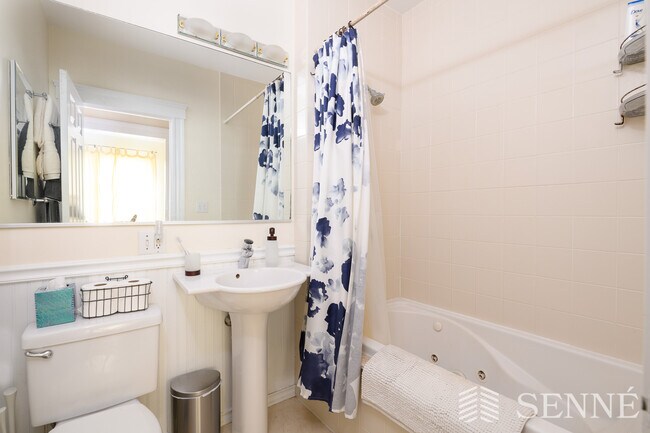
The condo is immaculate. Features abound including two way gas fire place separating the open concept formal dinning-room and spacious living room. The open modern kitchen faces out to the dinning-room and features granite counters with island, gas range stove, dishwasher, microwave, large french door stainless steel fridge. On-site laundry, high ceiling Hardwood floors throughout, abundant natural light, back deck patio and private yard complete this unique gem.

Range of Values:

Collateral Analytics

Collateral Analytics Collateral Analytics AVMs (Automated Valuation Model) employ a number of statistical approaches combined with neighborhood-specific comparable selection guarantees the most up-to-date and precise valuations.

Not Available

Collateral Analytics does not have data for the current month. Please view the chart for historical values.

ICE

ICE Mortgage Technology ICE Mortgage Technology’s AVM (Automated Valuation Model) is a state-of-the-art online residential property valuation tool that provides a quick and accurate estimate of the value of almost any home in the U.S.

Not Available

ICE Mortgage Technology does not have data for the current month. Please view the chart for historical values.

First American

First American First American Data & Analytics’ next-generation AVM combines unrivaled data assets with a blended ensemble of valuation models to produce highly accurate, reliable valuations you can trust.

Not Available

First American does not have data for the current month. Please view the chart for historical values.

Quantarium

Quantarium Quantarium’s valuation service, repeatedly proven the industry’s most accurate and comprehensive, is supercharged with a self-learning and auto-tuning AI engine that continually becomes smarter and more accurate as it processes daily inputs from the industry’s leading RE data lake.

Not Available

Quantarium does not have data for the current month. Please view the chart for historical values.

Average Value
Not Available
List Price
Sold Price
Create a Home Valuation Report for This Property
The Home Valuation Report is an in-depth analysis detailing your home's value as well as a comparison with similar homes in the area

Home Values in the Area

Source: Public Records

Average Home Value in this Area


Source: Public Records

Mortgage History

Date Status Borrower Loan Amount
Closed Rosen Jason $368,000
Closed Rosen Jason $100,000
Closed Rosen Jason $275,000
Source: Public Records

Property History

Date Event Price Change Sq Ft Price
08/30/2019 08/30/19 Rented $3,200 0.0% --
08/29/2019 08/29/19 Under Contract -- -- --
07/01/2019 07/01/19 For Rent $3,200 +16.4% --
10/28/2015 10/28/15 Rented $2,750 -1.8% --
10/25/2015 10/25/15 Under Contract -- -- --
10/16/2015 10/16/15 Price Changed $2,800 -5.1% $3 / Sq Ft
09/17/2015 09/17/15 For Rent $2,950 +3.5% --
05/26/2013 05/26/13 Rented $2,850 0.0% --
05/26/2013 05/26/13 For Rent $2,850 +5.6% --
06/24/2012 06/24/12 Rented $2,700 -3.6% --
05/25/2012 05/25/12 Under Contract -- -- --
05/16/2012 05/16/12 For Rent $2,800 -- --

Tax History Compared to Growth

Source: Public Records

Tax History

Year Tax Paid Tax Assessment Tax Assessment Total Assessment is a certain percentage of the fair market value that is determined by local assessors to be the total taxable value of land and additions on the property. Land Improvement
2025 $5,125 $807,100 $0 $807,100
2024 $4,737 $800,100 $0 $800,100
2023 $4,548 $776,100 $0 $776,100
2022 $4,530 $765,200 $0 $765,200
2021 $4,434 $757,900 $0 $757,900
2020 $4,266 $741,900 $0 $741,900
2019 $4,083 $687,400 $0 $687,400
2018 $3,963 $630,000 $0 $630,000
2017 $3,779 $582,300 $0 $582,300
2016 $3,677 $526,000 $0 $526,000
2015 $3,636 $464,900 $0 $464,900
2014 $3,474 $414,500 $0 $414,500
Source: Public Records

Agents Affiliated with this Home

  • Section Image
  • Section Image
  • Section Image
  • Section Image
See All Agents

Map