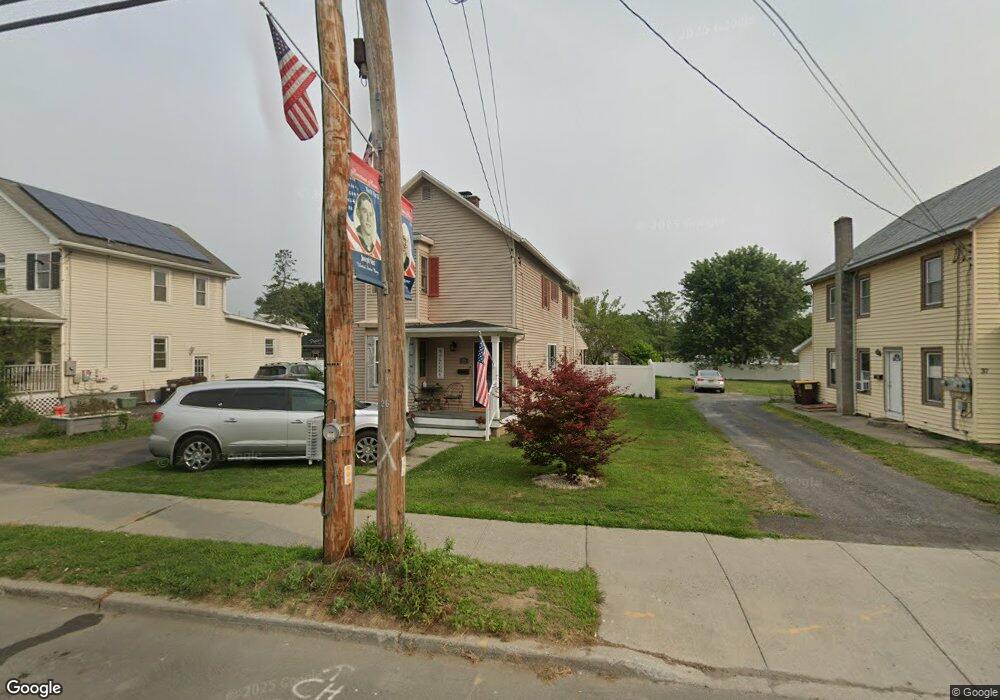
39 Main St Ravena, NY 12143
Estimated Value: $261,406 - $334,000
4
Beds
2
Baths
1,840
Sq Ft
$153/Sq Ft
Est. Value
About This Home
This home is located at 39 Main St, Ravena, NY 12143 and is currently estimated at $281,852, approximately $153 per square foot. 39 Main St is a home located in Albany County with nearby schools including Pieter B. Coeymans School, Ravena-Coeymans-Selkirk Middle School, and Ravena-Coeymans-Selkirk Senior High School.
Ownership History
Date
Name
Owned For
Owner Type
Purchase Details
Closed on
Jul 25, 2017
Sold by
Schell Guy Trisha
Bought by
U S Bank N A
Current Estimated Value
Purchase Details
Closed on
Oct 30, 2007
Sold by
Price William H
Bought by
Miller John
Home Financials for this Owner
Home Financials are based on the most recent Mortgage that was taken out on this home.
Original Mortgage
$157,500
Interest Rate
6.41%
Mortgage Type
New Conventional
Create a Home Valuation Report for This Property
The Home Valuation Report is an in-depth analysis detailing your home's value as well as a comparison with similar homes in the area
Purchase History
| Date | Buyer | Sale Price | Title Company |
|---|---|---|---|
| U S Bank N A | $40,167 | None Available | |
| Miller John | $175,000 | Anthony Arcodia |
Source: Public Records
Mortgage History
| Date | Status | Borrower | Loan Amount |
|---|---|---|---|
| Previous Owner | Miller John | $157,500 |
Source: Public Records
Tax History
| Year | Tax Paid | Tax Assessment Tax Assessment Total Assessment is a certain percentage of the fair market value that is determined by local assessors to be the total taxable value of land and additions on the property. | Land | Improvement |
|---|---|---|---|---|
| 2025 | $3,077 | $125,000 | $41,000 | $84,000 |
| 2024 | $3,077 | $125,000 | $41,000 | $84,000 |
| 2023 | $3,029 | $125,000 | $41,000 | $84,000 |
| 2022 | $1,545 | $125,000 | $41,000 | $84,000 |
| 2021 | $3,083 | $125,000 | $41,000 | $84,000 |
| 2020 | $3,286 | $125,000 | $41,000 | $84,000 |
| 2019 | $3,956 | $139,200 | $36,900 | $102,300 |
| 2018 | $3,890 | $139,200 | $36,900 | $102,300 |
| 2017 | $3,175 | $139,200 | $36,900 | $102,300 |
| 2016 | $5,278 | $139,200 | $36,900 | $102,300 |
| 2015 | -- | $139,200 | $36,900 | $102,300 |
| 2014 | -- | $139,200 | $36,900 | $102,300 |
Source: Public Records
Map
Nearby Homes
Your Personal Tour Guide
Ask me questions while you tour the home.