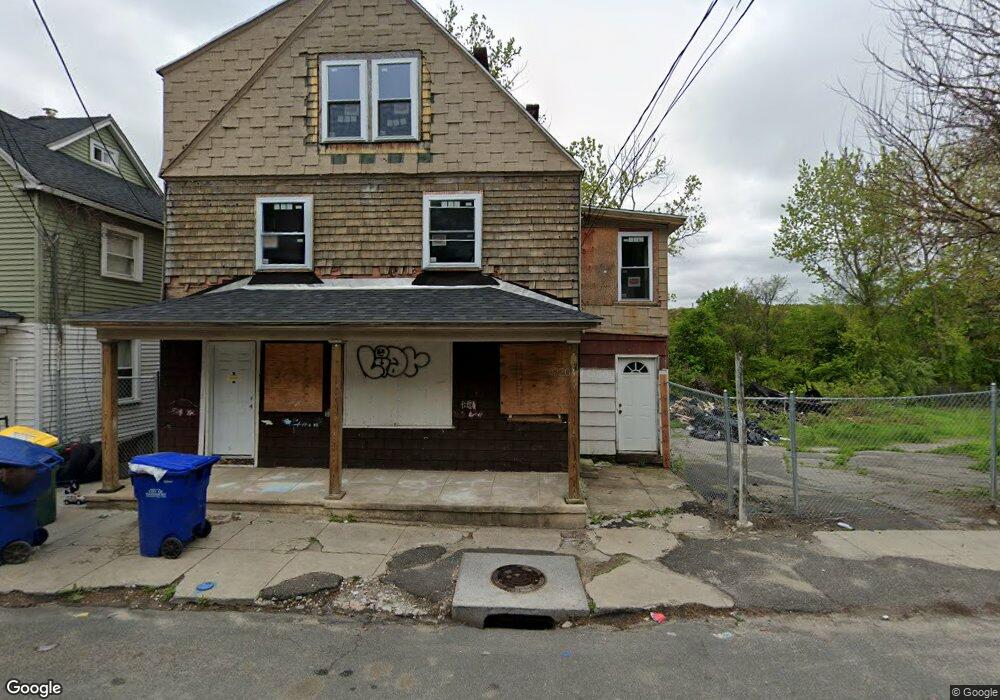
39 Manhan St Waterbury, CT 06710
Village of Waterbury NeighborhoodEstimated Value: $59,325 - $344,000
3
Beds
3
Baths
1,699
Sq Ft
$132/Sq Ft
Est. Value
About This Home
This home is located at 39 Manhan St, Waterbury, CT 06710 and is currently estimated at $225,081, approximately $132 per square foot. 39 Manhan St is a home located in New Haven County with nearby schools including West Side Middle School, John F. Kennedy High School, and Brass City Charter School.
Ownership History
Date
Name
Owned For
Owner Type
Purchase Details
Closed on
Jun 9, 2017
Sold by
Atz Realty Llc
Bought by
C & M Management Llc
Current Estimated Value
Purchase Details
Closed on
Apr 23, 2015
Sold by
Pesce William
Bought by
Antar Abraheem
Purchase Details
Closed on
Dec 31, 1998
Sold by
Tozzi Anthony
Bought by
Pesce William
Home Financials for this Owner
Home Financials are based on the most recent Mortgage that was taken out on this home.
Original Mortgage
$17,000
Interest Rate
6.84%
Mortgage Type
Purchase Money Mortgage
Create a Home Valuation Report for This Property
The Home Valuation Report is an in-depth analysis detailing your home's value as well as a comparison with similar homes in the area
Home Values in the Area
Average Home Value in this Area
Purchase History
| Date | Buyer | Sale Price | Title Company |
|---|---|---|---|
| C & M Management Llc | $11,000 | -- | |
| Antar Abraheem | $12,000 | -- | |
| Pesce William | $13,709 | -- | |
| Pesce William | $8,290 | -- |
Source: Public Records
Mortgage History
| Date | Status | Borrower | Loan Amount |
|---|---|---|---|
| Previous Owner | Pesce William | $17,000 |
Source: Public Records
Tax History Compared to Growth
Tax History
| Year | Tax Paid | Tax Assessment Tax Assessment Total Assessment is a certain percentage of the fair market value that is determined by local assessors to be the total taxable value of land and additions on the property. | Land | Improvement |
|---|---|---|---|---|
| 2025 | $2,374 | $52,780 | $8,260 | $44,520 |
| 2024 | $2,609 | $52,780 | $8,260 | $44,520 |
| 2023 | $2,860 | $52,780 | $8,260 | $44,520 |
| 2022 | $1,594 | $26,480 | $8,260 | $18,220 |
| 2021 | $1,594 | $26,480 | $8,260 | $18,220 |
| 2020 | $1,594 | $26,480 | $8,260 | $18,220 |
| 2019 | $1,594 | $26,480 | $8,260 | $18,220 |
| 2018 | $1,594 | $26,480 | $8,260 | $18,220 |
| 2017 | $1,602 | $26,600 | $8,250 | $18,350 |
| 2016 | $1,602 | $26,600 | $8,250 | $18,350 |
| 2015 | $1,549 | $26,600 | $8,250 | $18,350 |
| 2014 | $1,549 | $26,600 | $8,250 | $18,350 |
Source: Public Records
Map
Nearby Homes
- 232 Hillside Ave
- 57 Ridgewood St
- 50 Chestnut Ave
- 133 Willow St
- 26 Ridgewood St
- 271 Willow St
- 4 Ann St
- 28 Gilbert St
- 37 Plaza Ave
- 152 Lincoln St Unit 19
- 18 Pine St
- 184 Buckingham St
- 38 Kellogg St
- 181 Buckingham St
- 90 Pine St
- 67 Holmes Ave
- 96 Hillside Ave
- 33 Mitchell Ave
- 65 Cables Ave Unit 21
- 74 Holmes Ave
- 39 Manhan St
- 46 Manhan St
- 40 Manhan St
- 104 Fairview St
- 104 Fairview St Unit 1
- 37 Manhan St
- 50 Manhan St Unit 3
- 50 Manhan St Unit 2
- 50 Manhan St Unit 1
- 38 Manhan St
- 102 Fairview St
- 102 Fairview St Unit 3
- 102 Fairview St Unit 2
- 102 Fairview St Unit 1
- 31 Manhan St
- 96 Fairview St
- 96 Fairview St Unit 1
- 96 Fairview St Unit 2
- 93 Fairview St
- 92 Fairview St Unit 3