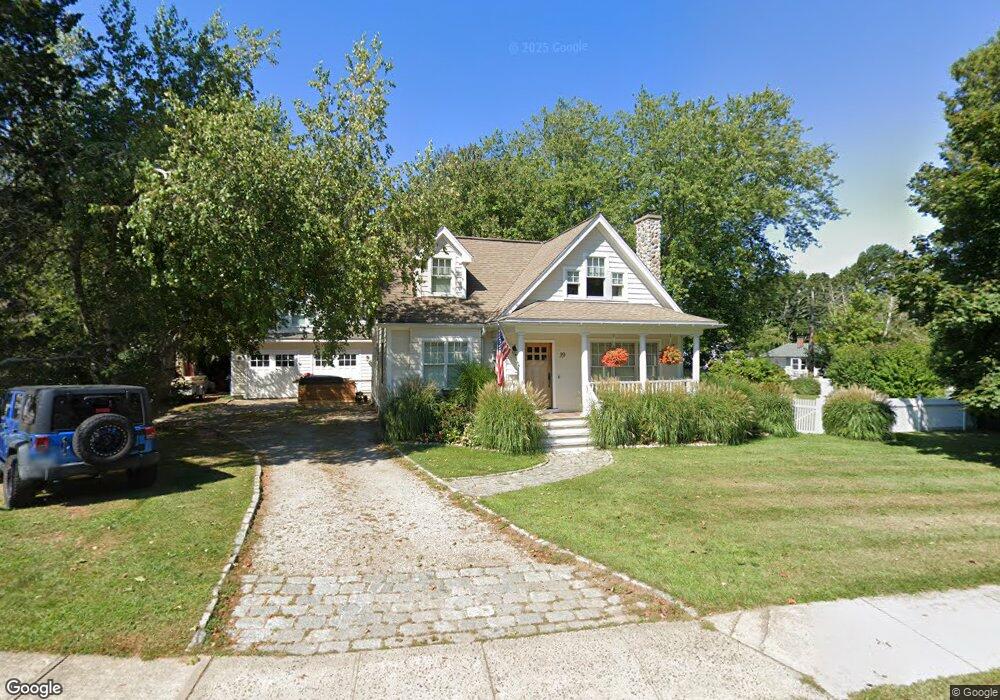
39 Maple Ave Old Saybrook, CT 06475
Estimated Value: $783,804 - $895,000
3
Beds
2
Baths
1,763
Sq Ft
$478/Sq Ft
Est. Value
About This Home
This home is located at 39 Maple Ave, Old Saybrook, CT 06475 and is currently estimated at $842,951, approximately $478 per square foot. 39 Maple Ave is a home located in Middlesex County with nearby schools including Kathleen E. Goodwin School, Old Saybrook Middle School, and Old Saybrook Senior High School.
Ownership History
Date
Name
Owned For
Owner Type
Purchase Details
Closed on
Aug 3, 1995
Sold by
Annino Samuel V
Bought by
Powers Ronald D and Powers Sheila L
Current Estimated Value
Purchase Details
Closed on
Aug 10, 1992
Sold by
Norwich Svgs Society
Bought by
Anino Samuel
Create a Home Valuation Report for This Property
The Home Valuation Report is an in-depth analysis detailing your home's value as well as a comparison with similar homes in the area
Home Values in the Area
Average Home Value in this Area
Purchase History
| Date | Buyer | Sale Price | Title Company |
|---|---|---|---|
| Powers Ronald D | $95,000 | -- | |
| Anino Samuel | $72,500 | -- |
Source: Public Records
Mortgage History
| Date | Status | Borrower | Loan Amount |
|---|---|---|---|
| Open | Anino Samuel | $90,000 | |
| Open | Anino Samuel | $359,650 | |
| Closed | Anino Samuel | $160,000 |
Source: Public Records
Tax History
| Year | Tax Paid | Tax Assessment Tax Assessment Total Assessment is a certain percentage of the fair market value that is determined by local assessors to be the total taxable value of land and additions on the property. | Land | Improvement |
|---|---|---|---|---|
| 2025 | $6,811 | $439,400 | $111,200 | $328,200 |
| 2024 | $6,679 | $439,400 | $111,200 | $328,200 |
| 2023 | $5,233 | $255,900 | $64,000 | $191,900 |
| 2022 | $5,138 | $255,900 | $64,000 | $191,900 |
| 2021 | $4,425 | $220,700 | $64,000 | $156,700 |
| 2020 | $4,425 | $220,700 | $64,000 | $156,700 |
| 2019 | $4,359 | $220,700 | $64,000 | $156,700 |
| 2018 | $4,886 | $249,300 | $56,900 | $192,400 |
| 2017 | $4,901 | $249,300 | $56,900 | $192,400 |
| 2016 | $4,802 | $249,300 | $56,900 | $192,400 |
| 2015 | $4,689 | $249,300 | $56,900 | $192,400 |
| 2014 | $4,612 | $249,300 | $56,900 | $192,400 |
Source: Public Records
Map
Nearby Homes
- 23 Clinton Ave
- 367 Main St Unit 7
- 2 Old South Cove Rd
- 13 College St
- 17 College St
- 41 Farview Ave
- 24 Church St
- 104 Knollwood Dr
- 105 Fenwood Dr
- 11 S View Terrace
- 24 Cottage Place
- 73 Knollwood Dr
- 18 Quarry St
- 10 Mulberry St
- 1 Beamon Meadow Place
- 125 Main St
- 100 Dudley Ave Unit F31
- 33 Fenwood Rd
- 1333A Boston Post Rd
- 25 Pond Rd
Your Personal Tour Guide
Ask me questions while you tour the home.