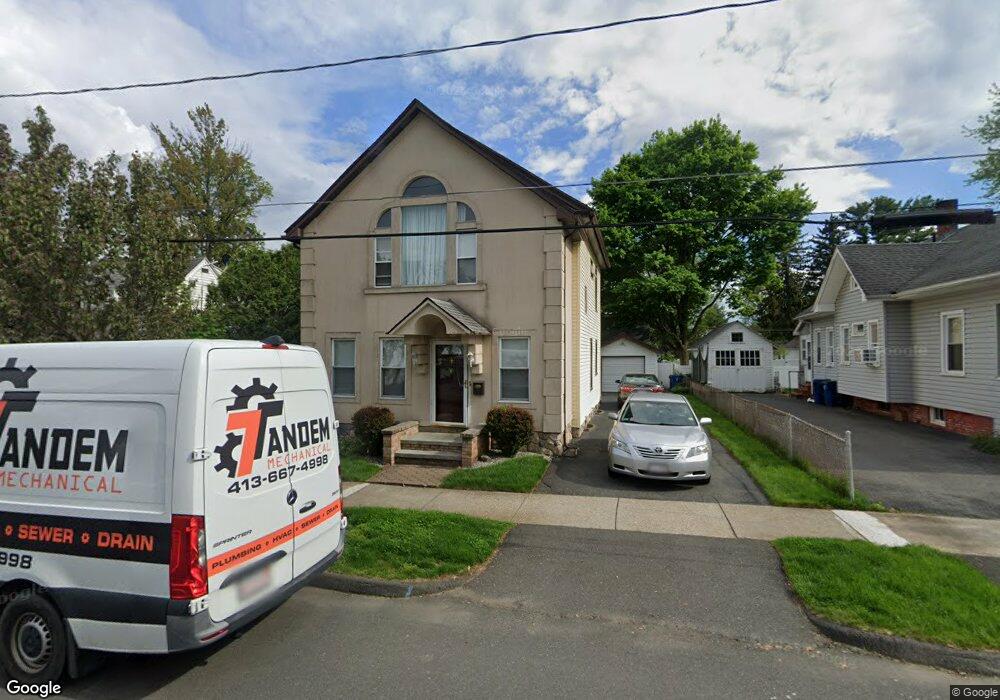
39 Maple St West Springfield, MA 01089
Estimated Value: $253,000 - $308,000
3
Beds
1
Bath
1,384
Sq Ft
$208/Sq Ft
Est. Value
About This Home
This home is located at 39 Maple St, West Springfield, MA 01089 and is currently estimated at $288,356, approximately $208 per square foot. 39 Maple St is a home located in Hampden County with nearby schools including West Springfield High School, Hampden Charter School of Science West, and St Thomas The Apostle School.
Ownership History
Date
Name
Owned For
Owner Type
Purchase Details
Closed on
Jan 17, 1997
Sold by
Fnma
Bought by
Kukharchuk Valentin
Current Estimated Value
Home Financials for this Owner
Home Financials are based on the most recent Mortgage that was taken out on this home.
Original Mortgage
$20,000
Outstanding Balance
$2,096
Interest Rate
7.36%
Mortgage Type
Purchase Money Mortgage
Estimated Equity
$286,260
Purchase Details
Closed on
Oct 28, 1996
Sold by
Stlaurent Craig A and Stlaurent Madelyn
Bought by
Federal National Mortgage Association
Purchase Details
Closed on
Sep 19, 1989
Sold by
Sayre Elizabeth
Bought by
Saint Laurent Craig A
Home Financials for this Owner
Home Financials are based on the most recent Mortgage that was taken out on this home.
Original Mortgage
$15,000
Interest Rate
9.58%
Mortgage Type
Purchase Money Mortgage
Create a Home Valuation Report for This Property
The Home Valuation Report is an in-depth analysis detailing your home's value as well as a comparison with similar homes in the area
Home Values in the Area
Average Home Value in this Area
Purchase History
| Date | Buyer | Sale Price | Title Company |
|---|---|---|---|
| Kukharchuk Valentin | $45,000 | -- | |
| Federal National Mortgage Association | $67,063 | -- | |
| Saint Laurent Craig A | $85,000 | -- |
Source: Public Records
Mortgage History
| Date | Status | Borrower | Loan Amount |
|---|---|---|---|
| Open | Saint Laurent Craig A | $20,000 | |
| Previous Owner | Saint Laurent Craig A | $15,000 |
Source: Public Records
Tax History
| Year | Tax Paid | Tax Assessment Tax Assessment Total Assessment is a certain percentage of the fair market value that is determined by local assessors to be the total taxable value of land and additions on the property. | Land | Improvement |
|---|---|---|---|---|
| 2025 | $3,557 | $239,200 | $97,200 | $142,000 |
| 2024 | $3,365 | $227,200 | $97,200 | $130,000 |
| 2023 | $3,193 | $205,500 | $95,000 | $110,500 |
| 2022 | $2,897 | $183,800 | $86,300 | $97,500 |
| 2021 | $2,846 | $168,400 | $78,400 | $90,000 |
| 2020 | $2,861 | $168,400 | $78,400 | $90,000 |
| 2019 | $2,856 | $168,400 | $78,400 | $90,000 |
| 2018 | $2,871 | $168,400 | $78,400 | $90,000 |
| 2017 | $2,871 | $168,400 | $78,400 | $90,000 |
| 2016 | $2,783 | $163,800 | $73,800 | $90,000 |
| 2015 | $2,729 | $160,600 | $72,300 | $88,300 |
| 2014 | $661 | $160,600 | $72,300 | $88,300 |
Source: Public Records
Map
Nearby Homes
Your Personal Tour Guide
Ask me questions while you tour the home.