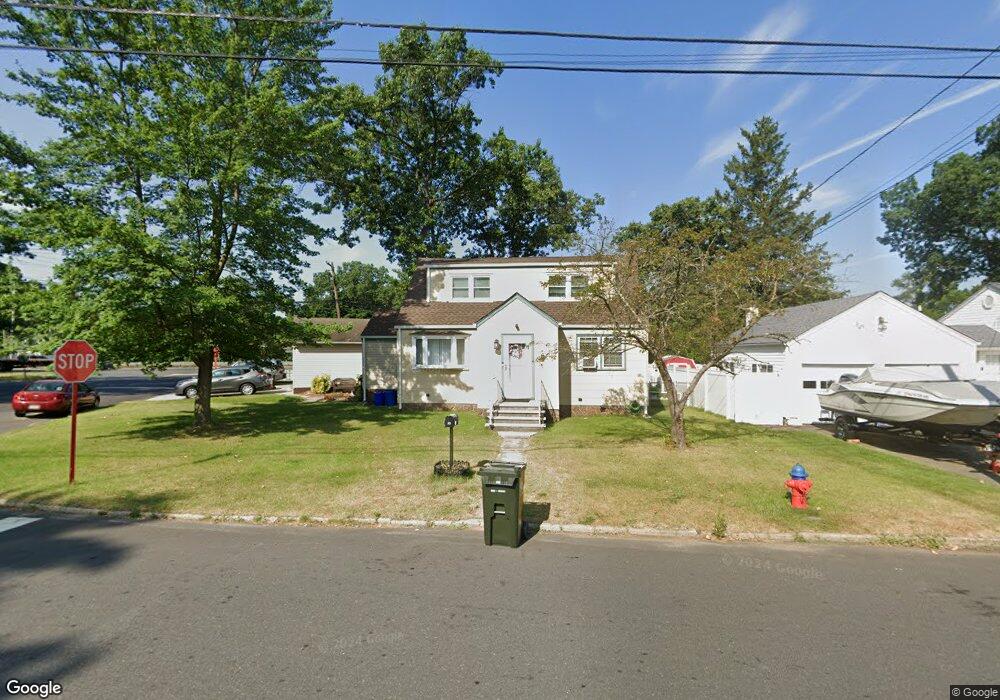
39 Marsad Dr Old Bridge, NJ 08857
Estimated Value: $424,277 - $545,000
--
Bed
--
Bath
1,080
Sq Ft
$455/Sq Ft
Est. Value
About This Home
This home is located at 39 Marsad Dr, Old Bridge, NJ 08857 and is currently estimated at $491,319, approximately $454 per square foot. 39 Marsad Dr is a home located in Middlesex County with nearby schools including Old Bridge High School and St. Thomas the Apostle School.
Ownership History
Date
Name
Owned For
Owner Type
Purchase Details
Closed on
Feb 28, 2010
Sold by
Murawski William
Bought by
Belardo Yvonne
Current Estimated Value
Home Financials for this Owner
Home Financials are based on the most recent Mortgage that was taken out on this home.
Original Mortgage
$160,128
Interest Rate
4.99%
Mortgage Type
New Conventional
Purchase Details
Closed on
Mar 28, 1996
Sold by
Gordzica Irene
Bought by
Ciaccio Patricia
Home Financials for this Owner
Home Financials are based on the most recent Mortgage that was taken out on this home.
Original Mortgage
$97,000
Interest Rate
7.31%
Create a Home Valuation Report for This Property
The Home Valuation Report is an in-depth analysis detailing your home's value as well as a comparison with similar homes in the area
Home Values in the Area
Average Home Value in this Area
Purchase History
| Date | Buyer | Sale Price | Title Company |
|---|---|---|---|
| Belardo Yvonne | -- | None Available | |
| Ciaccio Patricia | $121,000 | -- | |
| Murawski William | $108,000 | -- |
Source: Public Records
Mortgage History
| Date | Status | Borrower | Loan Amount |
|---|---|---|---|
| Previous Owner | Belardo Yvonne | $160,128 | |
| Previous Owner | Murawski William | $97,000 | |
| Previous Owner | Murawski William | $121,000 |
Source: Public Records
Tax History Compared to Growth
Tax History
| Year | Tax Paid | Tax Assessment Tax Assessment Total Assessment is a certain percentage of the fair market value that is determined by local assessors to be the total taxable value of land and additions on the property. | Land | Improvement |
|---|---|---|---|---|
| 2025 | $6,567 | $116,300 | $49,000 | $67,300 |
| 2024 | $6,300 | $116,300 | $49,000 | $67,300 |
| 2023 | $6,300 | $116,300 | $49,000 | $67,300 |
| 2022 | $6,156 | $116,300 | $49,000 | $67,300 |
| 2021 | $4,518 | $116,300 | $49,000 | $67,300 |
| 2020 | $5,974 | $116,300 | $49,000 | $67,300 |
| 2019 | $5,873 | $116,300 | $49,000 | $67,300 |
| 2018 | $5,808 | $116,300 | $49,000 | $67,300 |
| 2017 | $5,620 | $116,300 | $49,000 | $67,300 |
| 2016 | $5,503 | $116,300 | $49,000 | $67,300 |
| 2015 | $5,408 | $116,300 | $49,000 | $67,300 |
| 2014 | $5,353 | $116,300 | $49,000 | $67,300 |
Source: Public Records
Map
Nearby Homes