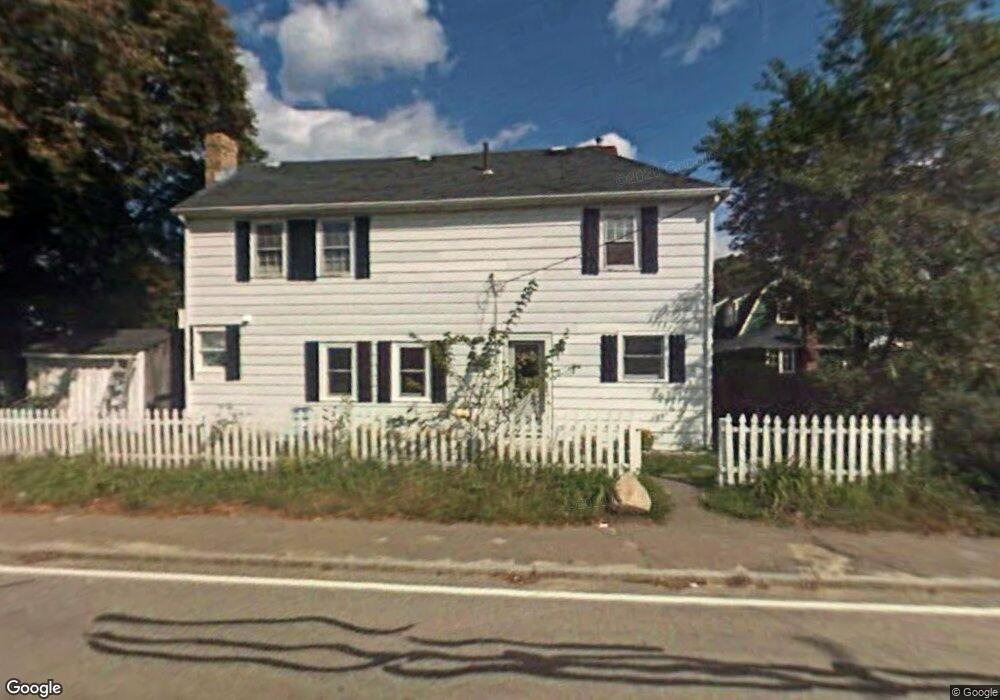
39 Marshall Ave Scituate, MA 02066
Estimated Value: $877,905 - $998,000
3
Beds
2
Baths
2,072
Sq Ft
$464/Sq Ft
Est. Value
About This Home
This home is located at 39 Marshall Ave, Scituate, MA 02066 and is currently estimated at $961,226, approximately $463 per square foot. 39 Marshall Ave is a home located in Plymouth County with nearby schools including Wampatuck Elementary School, Lester J. Gates Middle School, and Scituate High School.
Ownership History
Date
Name
Owned For
Owner Type
Purchase Details
Closed on
Feb 21, 2019
Sold by
Foley Marsha A and Lemire Barbara
Bought by
Lemire Barbara E
Current Estimated Value
Home Financials for this Owner
Home Financials are based on the most recent Mortgage that was taken out on this home.
Original Mortgage
$80,000
Outstanding Balance
$49,970
Interest Rate
4.4%
Mortgage Type
New Conventional
Estimated Equity
$911,256
Create a Home Valuation Report for This Property
The Home Valuation Report is an in-depth analysis detailing your home's value as well as a comparison with similar homes in the area
Home Values in the Area
Average Home Value in this Area
Purchase History
| Date | Buyer | Sale Price | Title Company |
|---|---|---|---|
| Lemire Barbara E | -- | -- |
Source: Public Records
Mortgage History
| Date | Status | Borrower | Loan Amount |
|---|---|---|---|
| Open | Lemire Barbara E | $80,000 |
Source: Public Records
Tax History
| Year | Tax Paid | Tax Assessment Tax Assessment Total Assessment is a certain percentage of the fair market value that is determined by local assessors to be the total taxable value of land and additions on the property. | Land | Improvement |
|---|---|---|---|---|
| 2025 | $7,378 | $738,500 | $387,500 | $351,000 |
| 2024 | $7,216 | $696,500 | $352,200 | $344,300 |
| 2023 | $5,901 | $553,400 | $320,200 | $233,200 |
| 2022 | $5,901 | $467,600 | $263,300 | $204,300 |
| 2021 | $5,580 | $418,600 | $238,200 | $180,400 |
| 2020 | $5,505 | $407,800 | $229,000 | $178,800 |
| 2019 | $5,492 | $399,700 | $224,500 | $175,200 |
| 2018 | $5,560 | $398,600 | $231,700 | $166,900 |
| 2017 | $5,474 | $388,500 | $221,600 | $166,900 |
| 2016 | $5,261 | $372,100 | $211,500 | $160,600 |
| 2015 | $4,744 | $362,100 | $201,500 | $160,600 |
Source: Public Records
Map
Nearby Homes
- 3 Egypt Ave
- 92 Marion Rd
- 33 Oceanside Dr
- 54 Woodland Rd
- 430 Hatherly Rd
- 430 Hatherly Rd Unit Exhibit “A”
- 430 Hatherly Rd Unit Exhibit “B”
- 23 Oceanside Dr
- 59 Captain Peirce Rd
- 86 Hatherly Rd
- 49 Jackson Rd
- 74 Branch St Unit 15
- 38 Lauren Ln
- 20 Lee Ave
- 20 Lawson Rd
- 49 Whittier Dr
- 32 Barker Rd Unit 3
- 1 Washington Ln
- 11 Brookline Rd
- 18A Mitchell Ave
Your Personal Tour Guide
Ask me questions while you tour the home.