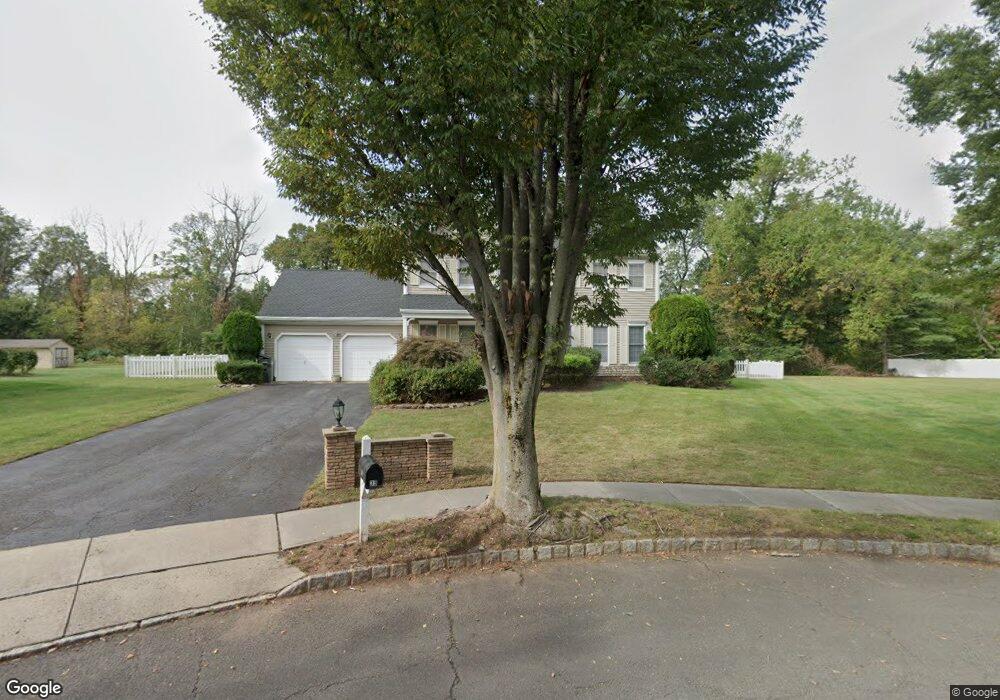
39 Matthew Ct Piscataway, NJ 08854
Estimated Value: $720,000 - $889,000
--
Bed
--
Bath
2,636
Sq Ft
$312/Sq Ft
Est. Value
About This Home
This home is located at 39 Matthew Ct, Piscataway, NJ 08854 and is currently estimated at $823,273, approximately $312 per square foot. 39 Matthew Ct is a home located in Middlesex County with nearby schools including Martin Luther King Intermediate School, Knollwood Elementary School, and Conackamack Middle School.
Ownership History
Date
Name
Owned For
Owner Type
Purchase Details
Closed on
Jun 14, 1996
Sold by
Kret Michael
Bought by
Mehta Rajeev and Mehta Nalini
Current Estimated Value
Home Financials for this Owner
Home Financials are based on the most recent Mortgage that was taken out on this home.
Original Mortgage
$200,000
Outstanding Balance
$13,023
Interest Rate
8.21%
Mortgage Type
Purchase Money Mortgage
Estimated Equity
$810,250
Create a Home Valuation Report for This Property
The Home Valuation Report is an in-depth analysis detailing your home's value as well as a comparison with similar homes in the area
Home Values in the Area
Average Home Value in this Area
Purchase History
| Date | Buyer | Sale Price | Title Company |
|---|---|---|---|
| Mehta Rajeev | $268,500 | -- |
Source: Public Records
Mortgage History
| Date | Status | Borrower | Loan Amount |
|---|---|---|---|
| Open | Mehta Rajeev | $200,000 |
Source: Public Records
Tax History Compared to Growth
Tax History
| Year | Tax Paid | Tax Assessment Tax Assessment Total Assessment is a certain percentage of the fair market value that is determined by local assessors to be the total taxable value of land and additions on the property. | Land | Improvement |
|---|---|---|---|---|
| 2025 | $12,239 | $715,100 | $426,900 | $288,200 |
| 2024 | $11,953 | $625,700 | $275,400 | $350,300 |
| 2023 | $11,953 | $571,900 | $275,400 | $296,500 |
| 2022 | $11,681 | $521,000 | $275,400 | $245,600 |
| 2021 | $11,858 | $495,200 | $275,400 | $219,800 |
| 2020 | $11,858 | $508,500 | $245,400 | $263,100 |
| 2019 | $10,994 | $463,700 | $245,400 | $218,300 |
| 2018 | $10,668 | $450,900 | $245,400 | $205,500 |
| 2017 | $11,671 | $426,900 | $225,400 | $201,500 |
| 2016 | $11,458 | $426,900 | $225,400 | $201,500 |
| 2015 | $11,292 | $426,900 | $225,400 | $201,500 |
| 2014 | $11,014 | $426,900 | $225,400 | $201,500 |
Source: Public Records
Map
Nearby Homes
- 21 Thornton Ln
- 9 Wilkens Dr
- 32 Canterbury Ct
- 5 Angela Ct
- 76 Woodland Rd
- 148 Woodland Rd
- 2 Sturbridge Dr
- 73 Morris Ave
- 126 Lakeside Dr N
- 418 Lancaster Ct Unit 62
- 27 Truman Terrace
- 110 Sylvan Ave
- 352 Lancaster Ct
- 336 Lancaster Ct Unit 2336
- 61 Lakeside Dr S
- 255 Hampshire Ct Unit D2
- 18 High Point Way
- 460 Sidney Rd
- 5 Boxwood Rd
- 17 Lake Park Dr