39 Mccallion St Unit 1 Swansea, MA 02777
Ocean Grove NeighborhoodEstimated Value: $453,419 - $518,000
3
Beds
2
Baths
1,672
Sq Ft
$292/Sq Ft
Est. Value
About This Home
This home is located at 39 Mccallion St Unit 1, Swansea, MA 02777 and is currently estimated at $488,605, approximately $292 per square foot. 39 Mccallion St Unit 1 is a home located in Bristol County with nearby schools including Joseph Case High School and Swansea Wood School.
Ownership History
Date
Name
Owned For
Owner Type
Purchase Details
Closed on
Jan 13, 2012
Sold by
Oneil Lori A
Bought by
Barrette Paul R
Current Estimated Value
Home Financials for this Owner
Home Financials are based on the most recent Mortgage that was taken out on this home.
Original Mortgage
$209,407
Outstanding Balance
$143,701
Interest Rate
4%
Mortgage Type
New Conventional
Estimated Equity
$344,904
Purchase Details
Closed on
Jan 14, 1993
Sold by
Davis Donald A and Davis Carol A
Bought by
Oneil Lori A
Home Financials for this Owner
Home Financials are based on the most recent Mortgage that was taken out on this home.
Original Mortgage
$92,000
Interest Rate
8.3%
Mortgage Type
Purchase Money Mortgage
Create a Home Valuation Report for This Property
The Home Valuation Report is an in-depth analysis detailing your home's value as well as a comparison with similar homes in the area
Home Values in the Area
Average Home Value in this Area
Purchase History
| Date | Buyer | Sale Price | Title Company |
|---|---|---|---|
| Barrette Paul R | $205,000 | -- | |
| Oneil Lori A | $100,000 | -- |
Source: Public Records
Mortgage History
| Date | Status | Borrower | Loan Amount |
|---|---|---|---|
| Open | Barrette Paul R | $209,407 | |
| Previous Owner | Oneil Lori A | $84,400 | |
| Previous Owner | Oneil Lori A | $92,000 | |
| Previous Owner | Oneil Lori A | $104,000 |
Source: Public Records
Tax History Compared to Growth
Tax History
| Year | Tax Paid | Tax Assessment Tax Assessment Total Assessment is a certain percentage of the fair market value that is determined by local assessors to be the total taxable value of land and additions on the property. | Land | Improvement |
|---|---|---|---|---|
| 2025 | $4,649 | $390,000 | $154,000 | $236,000 |
| 2024 | $4,580 | $382,000 | $150,000 | $232,000 |
| 2023 | $4,182 | $318,500 | $110,000 | $208,500 |
| 2022 | $4,059 | $282,100 | $100,000 | $182,100 |
| 2021 | $3,789 | $242,400 | $95,900 | $146,500 |
| 2020 | $3,973 | $255,000 | $100,100 | $154,900 |
| 2019 | $3,688 | $237,800 | $86,200 | $151,600 |
| 2018 | $3,563 | $233,200 | $81,600 | $151,600 |
| 2017 | $3,138 | $236,300 | $78,000 | $158,300 |
| 2016 | $3,003 | $222,100 | $75,400 | $146,700 |
| 2015 | $2,791 | $212,600 | $75,400 | $137,200 |
| 2014 | $2,687 | $209,300 | $75,400 | $133,900 |
Source: Public Records
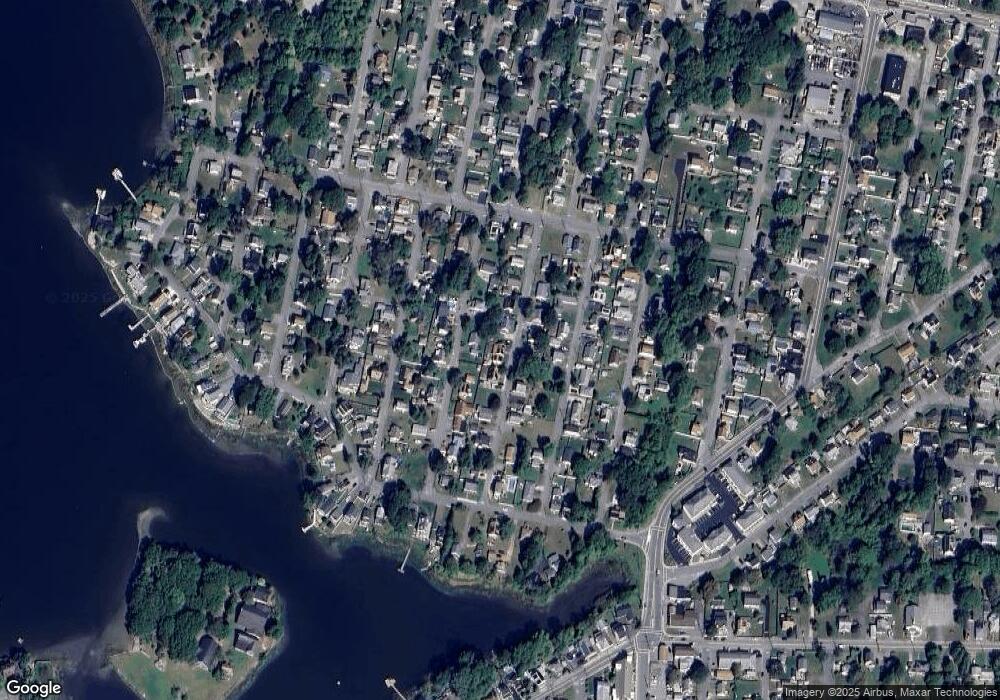
Map
Nearby Homes