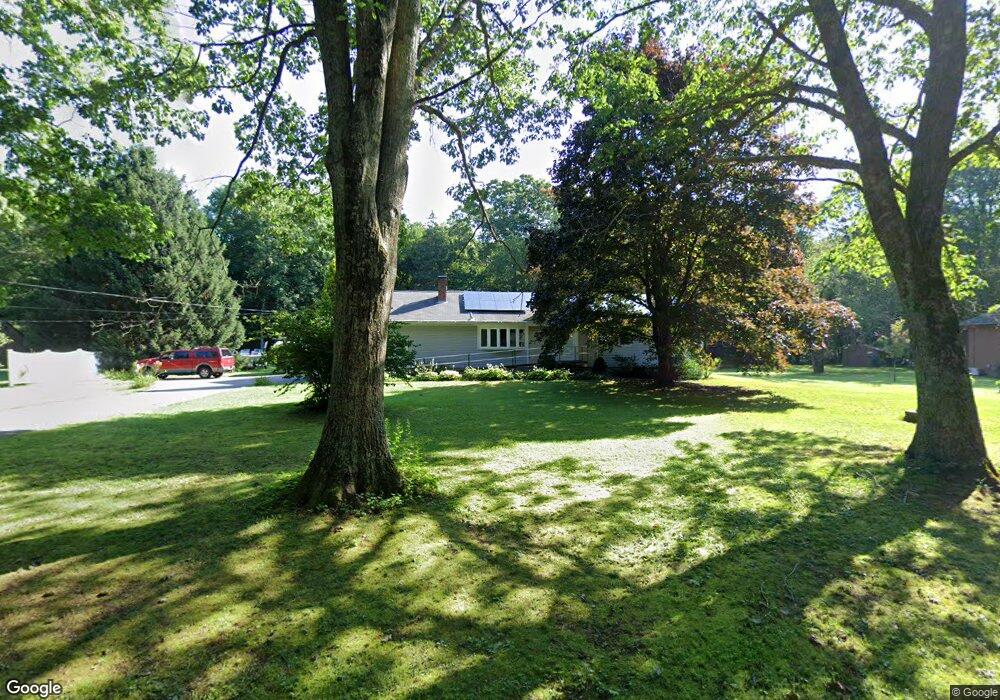
39 McDonald Rd Colchester, CT 06415
Estimated Value: $393,000 - $454,141
3
Beds
2
Baths
2,006
Sq Ft
$215/Sq Ft
Est. Value
About This Home
This home is located at 39 McDonald Rd, Colchester, CT 06415 and is currently estimated at $430,535, approximately $214 per square foot. 39 McDonald Rd is a home located in New London County with nearby schools including Colchester Elementary School, Jack Jackter Intermediate School, and William J. Johnston Middle School.
Ownership History
Date
Name
Owned For
Owner Type
Purchase Details
Closed on
Dec 10, 2014
Sold by
Evans Herbert C and Evans Jeanne S
Bought by
Evans Mary
Current Estimated Value
Home Financials for this Owner
Home Financials are based on the most recent Mortgage that was taken out on this home.
Original Mortgage
$170,000
Outstanding Balance
$127,644
Interest Rate
3%
Estimated Equity
$302,891
Purchase Details
Closed on
Jun 30, 1998
Sold by
Sollenberger Tammy L and Sollenberger Michael L
Bought by
Veseskis James P and Veseskis Darlene M
Home Financials for this Owner
Home Financials are based on the most recent Mortgage that was taken out on this home.
Original Mortgage
$125,000
Interest Rate
7.09%
Purchase Details
Closed on
Oct 9, 1990
Sold by
Woethington George
Bought by
Salenberger Michael
Home Financials for this Owner
Home Financials are based on the most recent Mortgage that was taken out on this home.
Original Mortgage
$139,500
Interest Rate
10.21%
Create a Home Valuation Report for This Property
The Home Valuation Report is an in-depth analysis detailing your home's value as well as a comparison with similar homes in the area
Home Values in the Area
Average Home Value in this Area
Purchase History
| Date | Buyer | Sale Price | Title Company |
|---|---|---|---|
| Evans Mary | $240,000 | -- | |
| Veseskis James P | $135,800 | -- | |
| Salenberger Michael | $155,000 | -- |
Source: Public Records
Mortgage History
| Date | Status | Borrower | Loan Amount |
|---|---|---|---|
| Open | Evans Mary | $170,000 | |
| Previous Owner | Salenberger Michael | $208,000 | |
| Previous Owner | Salenberger Michael | $125,000 | |
| Previous Owner | Salenberger Michael | $127,000 | |
| Previous Owner | Salenberger Michael | $139,500 |
Source: Public Records
Tax History
| Year | Tax Paid | Tax Assessment Tax Assessment Total Assessment is a certain percentage of the fair market value that is determined by local assessors to be the total taxable value of land and additions on the property. | Land | Improvement |
|---|---|---|---|---|
| 2025 | $6,256 | $209,100 | $41,100 | $168,000 |
| 2024 | $5,995 | $209,100 | $41,100 | $168,000 |
| 2023 | $5,692 | $209,100 | $41,100 | $168,000 |
| 2022 | $5,662 | $209,100 | $41,100 | $168,000 |
| 2021 | $5,363 | $163,300 | $41,100 | $122,200 |
| 2020 | $5,363 | $163,300 | $41,100 | $122,200 |
| 2019 | $5,363 | $163,300 | $41,100 | $122,200 |
| 2018 | $5,271 | $163,300 | $41,100 | $122,200 |
| 2017 | $5,286 | $163,300 | $41,100 | $122,200 |
| 2016 | $5,341 | $172,800 | $53,500 | $119,300 |
| 2015 | $5,315 | $172,800 | $53,500 | $119,300 |
| 2014 | $5,282 | $172,800 | $53,500 | $119,300 |
Source: Public Records
Map
Nearby Homes
Your Personal Tour Guide
Ask me questions while you tour the home.