Estimated Value: $538,000 - $739,000
3
Beds
2
Baths
1,300
Sq Ft
$463/Sq Ft
Est. Value
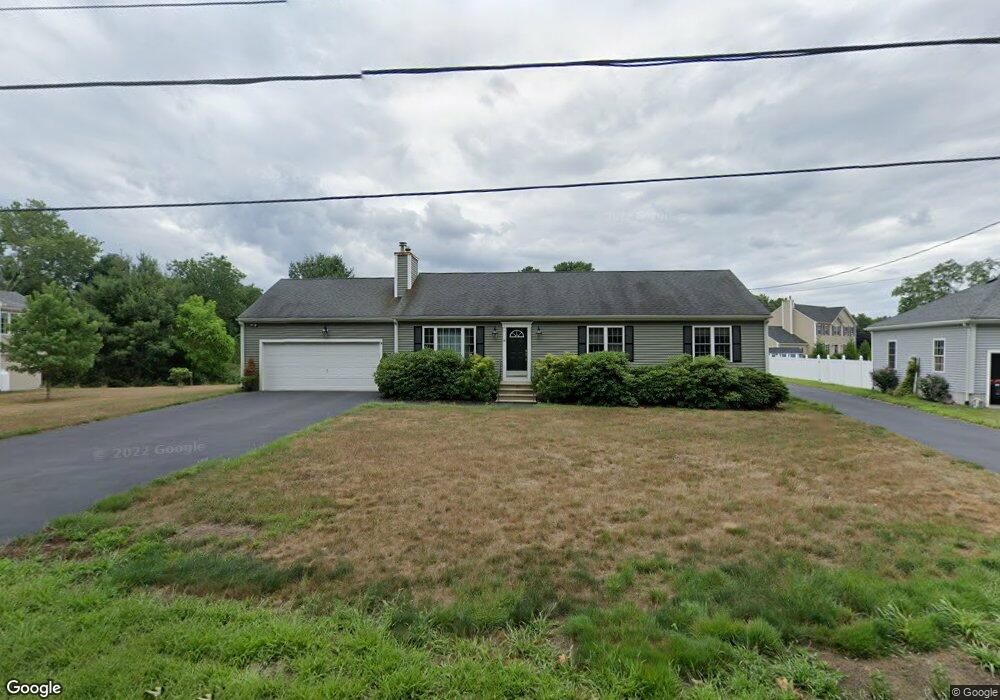
About This Home
This home is located at 39 Mendon St, Upton, MA 01568 and is currently estimated at $602,478, approximately $463 per square foot. 39 Mendon St is a home located in Worcester County with nearby schools including Nipmuc Regional High School, Touchstone Community School, and Silver Spruce Montessori School.
Ownership History
Date
Name
Owned For
Owner Type
Purchase Details
Closed on
Nov 14, 2013
Sold by
D & F Afonso Builders In
Bought by
Sauter Anthony J
Current Estimated Value
Home Financials for this Owner
Home Financials are based on the most recent Mortgage that was taken out on this home.
Original Mortgage
$253,280
Outstanding Balance
$187,803
Interest Rate
4.24%
Mortgage Type
New Conventional
Estimated Equity
$414,675
Create a Home Valuation Report for This Property
The Home Valuation Report is an in-depth analysis detailing your home's value as well as a comparison with similar homes in the area
Home Values in the Area
Average Home Value in this Area
Purchase History
| Date | Buyer | Sale Price | Title Company |
|---|---|---|---|
| Sauter Anthony J | $316,600 | -- | |
| Sauter Anthony J | $316,600 | -- | |
| Sauter Anthony J | $316,600 | -- | |
| Sauter Anthony J | $316,600 | -- |
Source: Public Records
Mortgage History
| Date | Status | Borrower | Loan Amount |
|---|---|---|---|
| Open | Sauter Anthony J | $253,280 | |
| Closed | Sauter Anthony J | $253,280 |
Source: Public Records
Tax History
| Year | Tax Paid | Tax Assessment Tax Assessment Total Assessment is a certain percentage of the fair market value that is determined by local assessors to be the total taxable value of land and additions on the property. | Land | Improvement |
|---|---|---|---|---|
| 2025 | $7,499 | $570,300 | $203,200 | $367,100 |
| 2024 | $7,520 | $549,700 | $197,700 | $352,000 |
| 2023 | $5,710 | $411,700 | $164,700 | $247,000 |
| 2022 | $6,872 | $409,800 | $164,700 | $245,100 |
| 2021 | $6,318 | $380,600 | $160,900 | $219,700 |
| 2020 | $6,700 | $389,100 | $135,600 | $253,500 |
| 2019 | $6,763 | $390,700 | $118,100 | $272,600 |
| 2018 | $5,827 | $338,200 | $120,200 | $218,000 |
| 2017 | $6,234 | $343,300 | $107,100 | $236,200 |
| 2016 | $6,314 | $340,200 | $93,900 | $246,300 |
| 2015 | $5,631 | $332,200 | $93,900 | $238,300 |
| 2014 | $4,883 | $288,100 | $93,900 | $194,200 |
Source: Public Records
Map
Nearby Homes
- 72 Main St
- 13 Plain St
- 3 Driscoll Ln
- 74 Warren St
- 63 Rockwood Ln Unit 63
- 6 Fieldstone Dr Unit 6
- 7 Fieldstone Dr Unit 7
- 8 Maple St
- 10 Mechanic St
- 31 Elm St
- 11 W Main St
- 13 Jonathans Way
- 130 High St
- 6 Wood St
- 27 James Rd Unit 1
- 27 James Rd Unit 2
- Lot 108 W Main St
- 29 Cider Mill Ln
- 1825 Quaker St
- 0 Emond St Unit 1
Your Personal Tour Guide
Ask me questions while you tour the home.