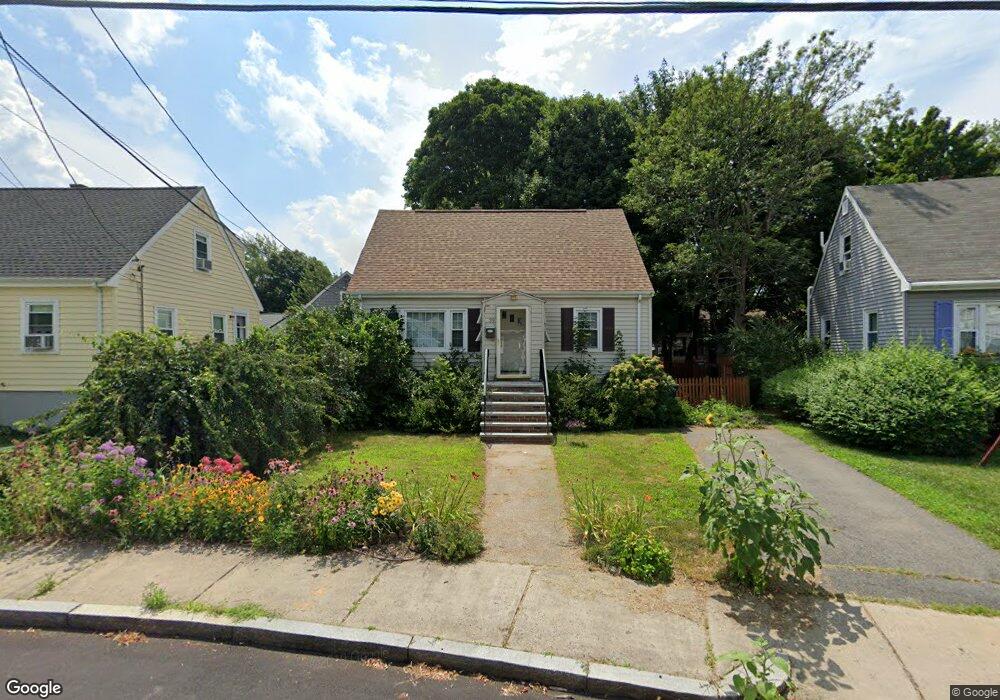
39 Meyer St Roslindale, MA 02131
Jamaica Plain NeighborhoodEstimated Value: $704,000 - $784,564
3
Beds
2
Baths
1,224
Sq Ft
$607/Sq Ft
Est. Value
About This Home
This home is located at 39 Meyer St, Roslindale, MA 02131 and is currently estimated at $742,641, approximately $606 per square foot. 39 Meyer St is a home located in Suffolk County with nearby schools including Brooke Charter School Roslindale and St. Clare High School.
Ownership History
Date
Name
Owned For
Owner Type
Purchase Details
Closed on
Jul 30, 2009
Sold by
Young Rebecca and Paulson Elizabeth
Bought by
Gonzalez Yolanda and Wilcox Emily J
Current Estimated Value
Home Financials for this Owner
Home Financials are based on the most recent Mortgage that was taken out on this home.
Original Mortgage
$338,827
Outstanding Balance
$223,383
Interest Rate
5.43%
Mortgage Type
FHA
Estimated Equity
$519,258
Purchase Details
Closed on
Jun 18, 2004
Sold by
Bell James J
Bought by
Paulson Elizabeth and Young Rebecca
Home Financials for this Owner
Home Financials are based on the most recent Mortgage that was taken out on this home.
Original Mortgage
$266,000
Interest Rate
6.12%
Mortgage Type
Purchase Money Mortgage
Create a Home Valuation Report for This Property
The Home Valuation Report is an in-depth analysis detailing your home's value as well as a comparison with similar homes in the area
Home Values in the Area
Average Home Value in this Area
Purchase History
| Date | Buyer | Sale Price | Title Company |
|---|---|---|---|
| Gonzalez Yolanda | $370,000 | -- | |
| Paulson Elizabeth | $333,000 | -- | |
| Bell James J | -- | -- |
Source: Public Records
Mortgage History
| Date | Status | Borrower | Loan Amount |
|---|---|---|---|
| Open | Gonzalez Yolanda | $338,827 | |
| Previous Owner | Bell James J | $268,000 | |
| Previous Owner | Bell James J | $266,000 |
Source: Public Records
Tax History Compared to Growth
Tax History
| Year | Tax Paid | Tax Assessment Tax Assessment Total Assessment is a certain percentage of the fair market value that is determined by local assessors to be the total taxable value of land and additions on the property. | Land | Improvement |
|---|---|---|---|---|
| 2025 | $7,858 | $678,600 | $199,700 | $478,900 |
| 2024 | $7,112 | $652,500 | $183,800 | $468,700 |
| 2023 | $6,547 | $609,600 | $171,700 | $437,900 |
| 2022 | $6,083 | $559,100 | $157,500 | $401,600 |
| 2021 | $5,792 | $542,800 | $152,900 | $389,900 |
| 2020 | $5,317 | $503,500 | $153,600 | $349,900 |
| 2019 | $5,055 | $479,600 | $125,600 | $354,000 |
| 2018 | $4,488 | $428,200 | $125,600 | $302,600 |
| 2017 | $4,447 | $419,900 | $125,600 | $294,300 |
| 2016 | $4,529 | $411,700 | $125,600 | $286,100 |
| 2015 | $4,712 | $389,100 | $143,700 | $245,400 |
| 2014 | $4,287 | $340,800 | $143,700 | $197,100 |
Source: Public Records
Map
Nearby Homes
- 71 Wyvern St
- 24 Waterman Rd
- 50 Southbourne Rd
- 105 Neponset Ave Unit 105
- 103 Neponset Ave Unit 103A
- 103-105 Neponset Ave
- 36 Neponset Ave Unit 1
- 348-350 Hyde Park Ave Unit 2
- 18-20 Northbourne Rd Unit 18
- 32 Jewett St
- 602 Canterbury St Unit 14
- 602 Canterbury St Unit 4
- 602 Canterbury St Unit 5
- 602 Canterbury St Unit 2
- 602 Canterbury St Unit 9
- 577-579 American Legion Hwy
- 579 American Legion Hwy
- 31 Rodman St Unit 2
- 31 Rodman St Unit 1
- 187 Florence St Unit 2L