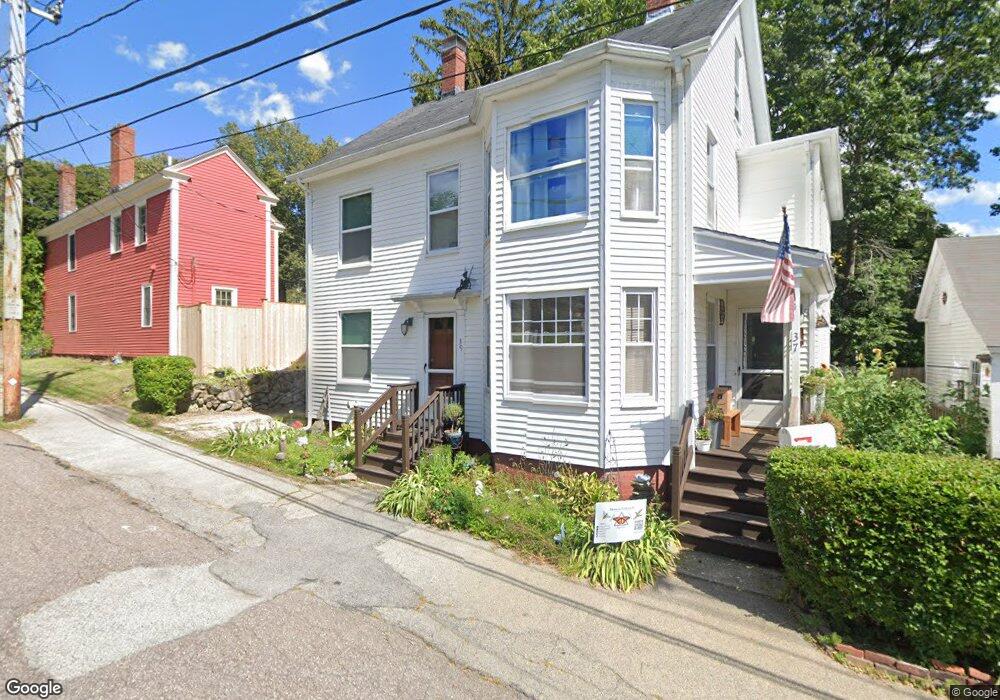
39 Mineral St Unit 39 Ipswich, MA 01938
Estimated Value: $698,000 - $806,000
3
Beds
1
Bath
1,200
Sq Ft
$624/Sq Ft
Est. Value
About This Home
This home is located at 39 Mineral St Unit 39, Ipswich, MA 01938 and is currently estimated at $749,110, approximately $624 per square foot. 39 Mineral St Unit 39 is a home located in Essex County with nearby schools including Ipswich High School, North Shore Montessori School, and Pingree School.
Ownership History
Date
Name
Owned For
Owner Type
Purchase Details
Closed on
Oct 28, 2016
Sold by
Gelineau Ashley R and Gelineau Matthew
Bought by
Doucette Raymond and Doucette Iris
Current Estimated Value
Home Financials for this Owner
Home Financials are based on the most recent Mortgage that was taken out on this home.
Original Mortgage
$345,000
Outstanding Balance
$276,191
Interest Rate
3.5%
Mortgage Type
New Conventional
Estimated Equity
$472,919
Purchase Details
Closed on
Mar 20, 2015
Sold by
Annese Denis G
Bought by
Gelineau Ashley R
Home Financials for this Owner
Home Financials are based on the most recent Mortgage that was taken out on this home.
Original Mortgage
$432,030
Interest Rate
3.5%
Mortgage Type
FHA
Purchase Details
Closed on
Aug 26, 2014
Sold by
Hwalek Edward G Est and Oconnor
Bought by
Hwalek Winifred M and Felciano Edwin
Create a Home Valuation Report for This Property
The Home Valuation Report is an in-depth analysis detailing your home's value as well as a comparison with similar homes in the area
Home Values in the Area
Average Home Value in this Area
Purchase History
| Date | Buyer | Sale Price | Title Company |
|---|---|---|---|
| Doucette Raymond | $460,000 | -- | |
| Gelineau Ashley R | $445,000 | -- | |
| Hwalek Winifred M | $89,000 | -- | |
| Annese Denis G | $265,000 | -- | |
| Hwalek Winifred M | -- | -- | |
| Hwalek Winifred M | -- | -- | |
| Hwalek Winifred M | $89,000 | -- | |
| Hwalek Winifred M | $89,000 | -- |
Source: Public Records
Mortgage History
| Date | Status | Borrower | Loan Amount |
|---|---|---|---|
| Open | Doucette Raymond | $345,000 | |
| Closed | Doucette Raymond | $345,000 | |
| Previous Owner | Gelineau Ashley R | $432,030 |
Source: Public Records
Tax History
| Year | Tax Paid | Tax Assessment Tax Assessment Total Assessment is a certain percentage of the fair market value that is determined by local assessors to be the total taxable value of land and additions on the property. | Land | Improvement |
|---|---|---|---|---|
| 2025 | $7,290 | $653,800 | $286,100 | $367,700 |
| 2024 | $6,584 | $578,600 | $286,100 | $292,500 |
| 2023 | $6,148 | $502,700 | $222,500 | $280,200 |
| 2022 | $6,004 | $466,900 | $213,000 | $253,900 |
| 2021 | $5,924 | $448,100 | $211,400 | $236,700 |
| 2020 | $6,121 | $436,600 | $216,200 | $220,400 |
| 2019 | $5,770 | $409,500 | $209,800 | $199,700 |
| 2018 | $5,649 | $396,700 | $198,700 | $198,000 |
| 2017 | $5,638 | $397,300 | $190,700 | $206,600 |
| 2016 | $5,082 | $342,200 | $171,700 | $170,500 |
| 2015 | $3,987 | $295,100 | $165,300 | $129,800 |
Source: Public Records
Map
Nearby Homes
- 11 Washington St Unit 11
- 11 Washington St Unit 7
- 11 Washington St Unit 5
- 11 Washington St Unit 4
- 11 Washington St Unit 12
- 8 Cleveland Ave
- 50 Market St Unit 2
- 20 Caroline Ave
- 29 Summer St Unit 15
- 16 Elm St
- 59 S Main St Unit 1
- 9 Ryan Ave
- 45 County St Unit 4
- 21 Brownville Ave
- 64 County Rd Unit 1
- 57 East St
- 70 East St
- 7 Woods Ln
- 500 Colonial Dr Unit 5
- 500 Colonial Dr Unit 310
Your Personal Tour Guide
Ask me questions while you tour the home.