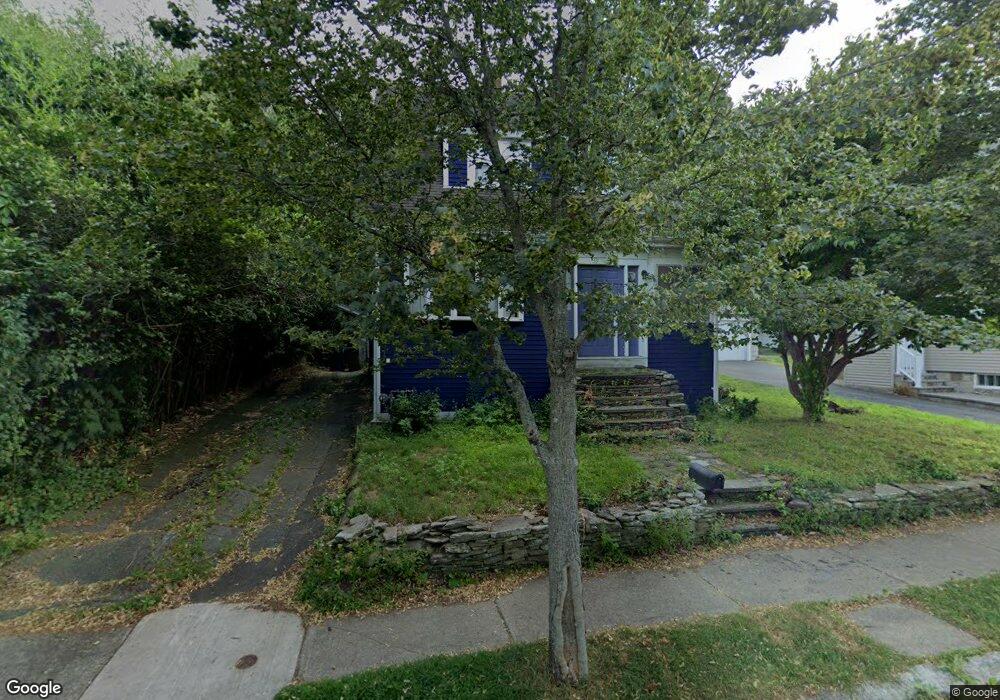
39 Moffatt Rd Salem, MA 01970
South Salem NeighborhoodEstimated Value: $743,000 - $894,000
5
Beds
2
Baths
1,918
Sq Ft
$415/Sq Ft
Est. Value
About This Home
This home is located at 39 Moffatt Rd, Salem, MA 01970 and is currently estimated at $796,204, approximately $415 per square foot. 39 Moffatt Rd is a home located in Essex County with nearby schools including Saltonstall School, Horace Mann Laboratory, and Witchcraft Heights Elementary School.
Ownership History
Date
Name
Owned For
Owner Type
Purchase Details
Closed on
Jun 21, 2004
Sold by
Paublant Fabrice A and Paublant Maria M
Bought by
Mactaylor Ronald S
Current Estimated Value
Purchase Details
Closed on
Aug 13, 2001
Sold by
Wilkins Mark A and Klein Laurie A
Bought by
Paublant Fabrice A and Paublant Maria M
Purchase Details
Closed on
Aug 22, 1994
Sold by
Tucker Paul F and Tucker Ann K
Bought by
Wilkins Mark A and Klein Lauri
Create a Home Valuation Report for This Property
The Home Valuation Report is an in-depth analysis detailing your home's value as well as a comparison with similar homes in the area
Home Values in the Area
Average Home Value in this Area
Purchase History
| Date | Buyer | Sale Price | Title Company |
|---|---|---|---|
| Mactaylor Ronald S | $370,000 | -- | |
| Paublant Fabrice A | $294,000 | -- | |
| Wilkins Mark A | $159,000 | -- |
Source: Public Records
Mortgage History
| Date | Status | Borrower | Loan Amount |
|---|---|---|---|
| Open | Wilkins Mark A | $251,000 | |
| Closed | Wilkins Mark A | $50,000 |
Source: Public Records
Tax History Compared to Growth
Tax History
| Year | Tax Paid | Tax Assessment Tax Assessment Total Assessment is a certain percentage of the fair market value that is determined by local assessors to be the total taxable value of land and additions on the property. | Land | Improvement |
|---|---|---|---|---|
| 2025 | $7,264 | $640,600 | $223,600 | $417,000 |
| 2024 | $7,025 | $604,600 | $211,000 | $393,600 |
| 2023 | $6,672 | $533,300 | $192,100 | $341,200 |
| 2022 | $6,237 | $470,700 | $176,300 | $294,400 |
| 2021 | $6,254 | $453,200 | $163,700 | $289,500 |
| 2020 | $6,151 | $425,700 | $160,600 | $265,100 |
| 2019 | $6,016 | $398,400 | $151,200 | $247,200 |
| 2018 | $5,798 | $377,000 | $141,100 | $235,900 |
| 2017 | $5,710 | $360,000 | $132,300 | $227,700 |
| 2016 | $5,641 | $360,000 | $132,300 | $227,700 |
| 2015 | $5,300 | $323,000 | $116,500 | $206,500 |
Source: Public Records
Map
Nearby Homes
- 10 Quadrant Rd
- 11 Sumner Rd
- 23 Marion Rd Unit B
- 2 Fletcher Way Unit 34D
- 3 Cedarcrest Rd
- 2 Wilfred Terrace
- 6 Loring Hills Ave Unit D3
- 9 Tedesco Pond Place Unit 9
- 86 Freedom Hollow
- 263 Jefferson Ave
- 24 Wisteria St Unit 2
- 29 Willson St
- 327 Lafayette St Unit 2
- 1006 Paradise Rd Unit 3R
- 27 Weatherly Dr Unit 27
- 24 Weatherly Dr Unit 1
- 1002 Paradise Rd Unit PHE
- 10 Horton St
- 1 Laurent Rd Unit 3
- 1004 Paradise Rd Unit PHJ