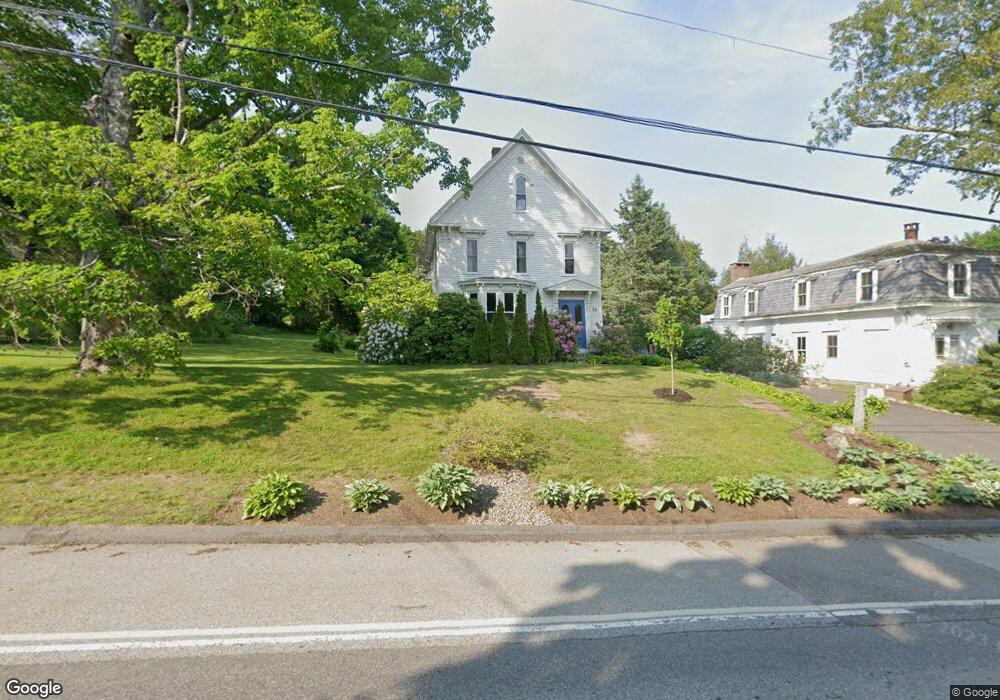
39 Mountain St Camden, ME 04843
Estimated Value: $776,000 - $1,048,473
4
Beds
3
Baths
2,721
Sq Ft
$335/Sq Ft
Est. Value
About This Home
This home is located at 39 Mountain St, Camden, ME 04843 and is currently estimated at $912,368, approximately $335 per square foot. 39 Mountain St is a home located in Knox County with nearby schools including Camden-Rockport Elementary School, Camden-Rockport Middle School, and Camden Hills Regional High School.
Ownership History
Date
Name
Owned For
Owner Type
Purchase Details
Closed on
Aug 6, 2010
Sold by
Michael S Nicholson T S and Michael Galloway-Nicholson
Bought by
Michael S Nicholson T S and Michael Galloway-Nicholson
Current Estimated Value
Purchase Details
Closed on
May 8, 2008
Sold by
Nicholson Michael S and Nicholson Michael S
Bought by
Michael S Nicholson T S and Michael Nicholson
Create a Home Valuation Report for This Property
The Home Valuation Report is an in-depth analysis detailing your home's value as well as a comparison with similar homes in the area
Home Values in the Area
Average Home Value in this Area
Purchase History
| Date | Buyer | Sale Price | Title Company |
|---|---|---|---|
| Michael S Nicholson T S | -- | -- | |
| Michael S Nicholson T S | -- | -- | |
| Michael S Nicholson T S | -- | -- | |
| Michael S Nicholson T S | -- | -- |
Source: Public Records
Tax History Compared to Growth
Tax History
| Year | Tax Paid | Tax Assessment Tax Assessment Total Assessment is a certain percentage of the fair market value that is determined by local assessors to be the total taxable value of land and additions on the property. | Land | Improvement |
|---|---|---|---|---|
| 2024 | $8,495 | $809,000 | $225,200 | $583,800 |
| 2023 | $7,609 | $551,400 | $128,400 | $423,000 |
| 2022 | $7,278 | $551,400 | $128,400 | $423,000 |
| 2021 | $6,817 | $444,100 | $100,000 | $344,100 |
| 2020 | $6,675 | $444,100 | $100,000 | $344,100 |
| 2019 | $6,622 | $444,100 | $100,000 | $344,100 |
| 2018 | $5,919 | $397,800 | $113,700 | $284,100 |
| 2017 | $5,720 | $397,800 | $113,700 | $284,100 |
| 2016 | $5,282 | $338,800 | $73,500 | $265,300 |
| 2015 | $5,126 | $338,800 | $73,500 | $265,300 |
| 2014 | $4,889 | $338,800 | $73,500 | $265,300 |
| 2013 | $4,757 | $338,800 | $73,500 | $265,300 |
Source: Public Records
Map
Nearby Homes