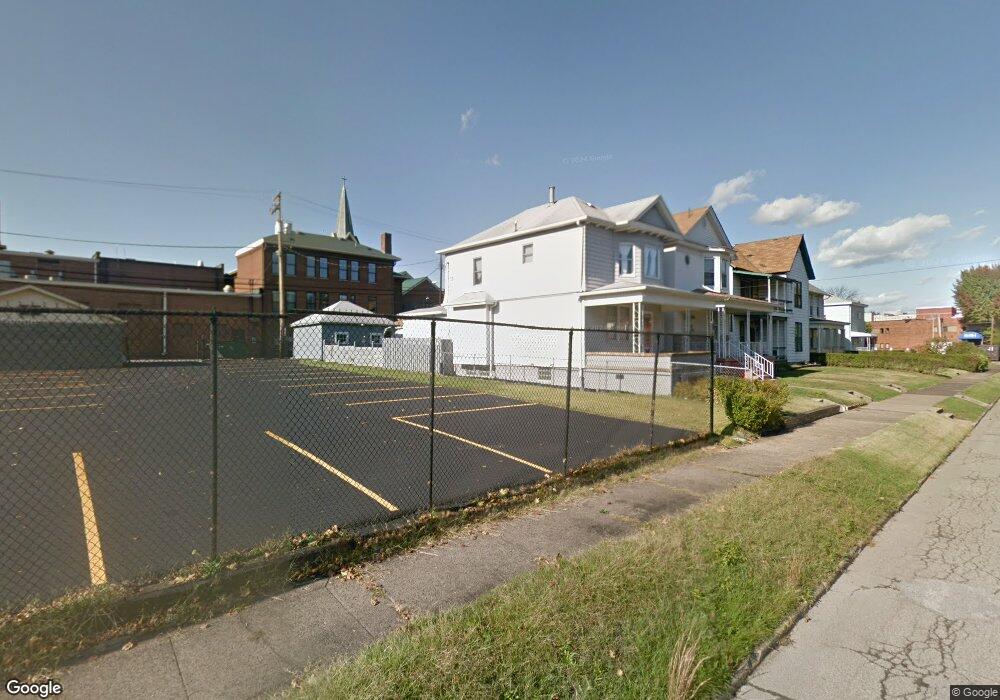
39 N 3rd St Martins Ferry, OH 43935
Estimated Value: $104,000 - $118,000
3
Beds
2
Baths
1,428
Sq Ft
$76/Sq Ft
Est. Value
About This Home
This home is located at 39 N 3rd St, Martins Ferry, OH 43935 and is currently estimated at $108,071, approximately $75 per square foot. 39 N 3rd St is a home located in Belmont County with nearby schools including Anna Marie Ayers Elementary School, Martins Ferry Middle School, and Martins Ferry High School.
Ownership History
Date
Name
Owned For
Owner Type
Purchase Details
Closed on
Aug 24, 2023
Sold by
Brookside Realty Llc
Bought by
Youngs Construction 4U Llc
Current Estimated Value
Purchase Details
Closed on
May 15, 2023
Sold by
Roth Lois J
Bought by
Brookside Realty Llc
Purchase Details
Closed on
Jun 5, 2020
Sold by
Estate Of Lawrence Terry Roth Sr
Bought by
Roth Lois J
Purchase Details
Closed on
Jan 1, 1987
Sold by
Roth Lawrence T and Roth Lois J
Bought by
Roth Lawrence T and Roth Lois J
Create a Home Valuation Report for This Property
The Home Valuation Report is an in-depth analysis detailing your home's value as well as a comparison with similar homes in the area
Home Values in the Area
Average Home Value in this Area
Purchase History
| Date | Buyer | Sale Price | Title Company |
|---|---|---|---|
| Youngs Construction 4U Llc | $113,333 | Northwest Title | |
| Brookside Realty Llc | $70,666 | None Listed On Document | |
| Brookside Realty Llc | $70,666 | None Listed On Document | |
| Roth Lois J | -- | None Available | |
| Roth Lawrence T | -- | -- |
Source: Public Records
Tax History
| Year | Tax Paid | Tax Assessment Tax Assessment Total Assessment is a certain percentage of the fair market value that is determined by local assessors to be the total taxable value of land and additions on the property. | Land | Improvement |
|---|---|---|---|---|
| 2025 | $1,714 | $27,460 | $2,150 | $25,310 |
| 2024 | $1,490 | $27,460 | $2,150 | $25,310 |
| 2023 | $423 | $18,600 | $2,160 | $16,440 |
| 2022 | $442 | $18,599 | $2,163 | $16,436 |
| 2021 | $441 | $18,602 | $2,166 | $16,436 |
| 2020 | $363 | $16,290 | $1,880 | $14,410 |
| 2019 | $366 | $16,290 | $1,880 | $14,410 |
| 2018 | $349 | $16,290 | $1,880 | $14,410 |
| 2017 | $484 | $18,900 | $1,850 | $17,050 |
| 2016 | $488 | $18,900 | $1,850 | $17,050 |
| 2015 | $441 | $18,900 | $1,850 | $17,050 |
| 2014 | $404 | $17,910 | $1,680 | $16,230 |
| 2013 | $376 | $17,910 | $1,680 | $16,230 |
Source: Public Records
Map
Nearby Homes
- 37 N 4th St
- 811 Park St
- 840 Hanover St
- 809 Delia Ave
- 0 Delia Ave
- 500 N 8th St
- 424 Elm St
- 637 and 639 Dehass St
- 800 Euclid Ave
- 717 Elm St
- 900 N 6th St
- 820 Mariann Dr
- 340 W Cardinal Ave
- 527 Virginia St
- 912 & 914 S Zane Hwy
- 1053 Broadway St
- 1020 Virginia St
- 1105 N 6th St
- 1209 N 8th St
- 57640 Ferryview Rd