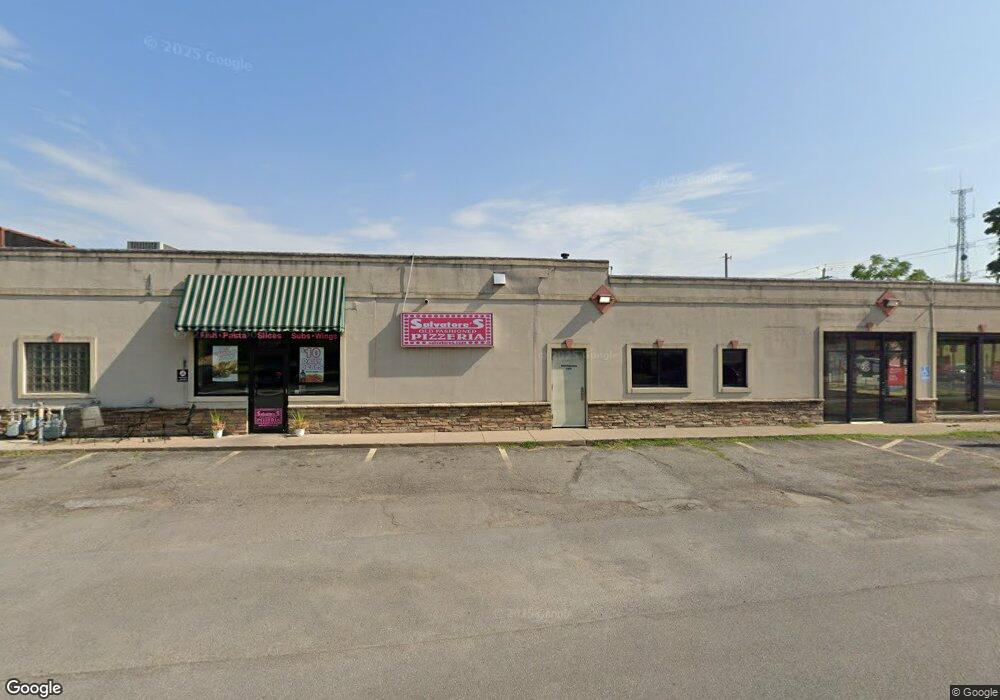
39 N Main St Brockport, NY 14420
Estimated Value: $316,297
--
Bed
--
Bath
9,014
Sq Ft
$35/Sq Ft
Est. Value
About This Home
This home is located at 39 N Main St, Brockport, NY 14420 and is currently estimated at $316,297, approximately $35 per square foot. 39 N Main St is a home located in Monroe County with nearby schools including Ginther Elementary School, Barclay Elementary School, and Fred W. Hill Elementary School.
Ownership History
Date
Name
Owned For
Owner Type
Purchase Details
Closed on
May 25, 2021
Sold by
Leap Holdings Llc
Bought by
Qc Canalside Properties Llc
Current Estimated Value
Home Financials for this Owner
Home Financials are based on the most recent Mortgage that was taken out on this home.
Original Mortgage
$410,000
Outstanding Balance
$370,394
Interest Rate
2.9%
Mortgage Type
Purchase Money Mortgage
Estimated Equity
-$54,097
Purchase Details
Closed on
Sep 17, 2008
Sold by
Enos David
Bought by
Canal Ridge Properties I
Home Financials for this Owner
Home Financials are based on the most recent Mortgage that was taken out on this home.
Original Mortgage
$175,000
Interest Rate
6.54%
Mortgage Type
Construction
Purchase Details
Closed on
May 16, 2008
Sold by
Heaster William
Bought by
Enos David
Create a Home Valuation Report for This Property
The Home Valuation Report is an in-depth analysis detailing your home's value as well as a comparison with similar homes in the area
Home Values in the Area
Average Home Value in this Area
Purchase History
| Date | Buyer | Sale Price | Title Company |
|---|---|---|---|
| Qc Canalside Properties Llc | -- | Stewart Title Insurance Co | |
| Qc Canalside Properties Llc | -- | Stewart Title | |
| Canal Ridge Properties I | -- | Charles C Welch | |
| Enos David | $140,000 | Charlie Wel Ch |
Source: Public Records
Mortgage History
| Date | Status | Borrower | Loan Amount |
|---|---|---|---|
| Open | Qc Canalside Properties Llc | $410,000 | |
| Closed | Qc Canalside Properties Llc | $410,000 | |
| Previous Owner | Canal Ridge Properties I | $175,000 |
Source: Public Records
Tax History Compared to Growth
Tax History
| Year | Tax Paid | Tax Assessment Tax Assessment Total Assessment is a certain percentage of the fair market value that is determined by local assessors to be the total taxable value of land and additions on the property. | Land | Improvement |
|---|---|---|---|---|
| 2024 | $18,059 | $417,300 | $154,600 | $262,700 |
| 2023 | $18,059 | $399,400 | $105,200 | $294,200 |
| 2022 | $17,693 | $399,400 | $105,200 | $294,200 |
| 2021 | $17,646 | $365,000 | $94,900 | $270,100 |
| 2020 | $18,461 | $365,000 | $94,900 | $270,100 |
| 2019 | $18,272 | $365,000 | $94,900 | $270,100 |
| 2018 | $18,549 | $365,000 | $94,900 | $270,100 |
| 2017 | $8,714 | $356,300 | $82,400 | $273,900 |
| 2016 | $18,272 | $356,300 | $82,400 | $273,900 |
| 2015 | -- | $356,300 | $82,400 | $273,900 |
| 2014 | -- | $356,300 | $82,400 | $273,900 |
Source: Public Records
Map
Nearby Homes