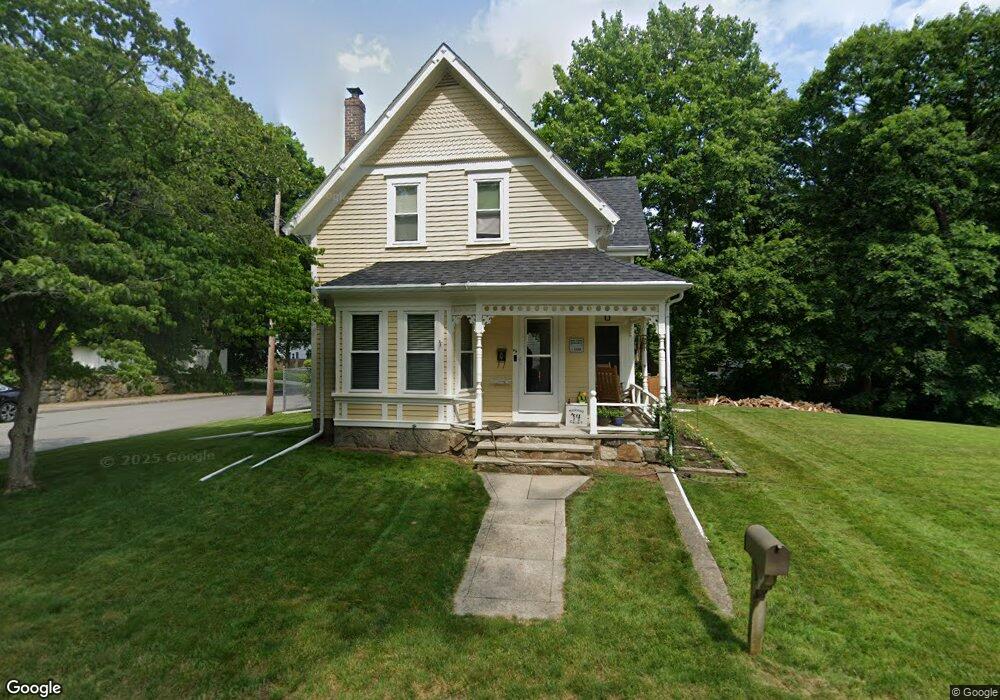
39 N Main St North Easton, MA 02356
Estimated Value: $428,000 - $610,000
3
Beds
2
Baths
1,090
Sq Ft
$491/Sq Ft
Est. Value
About This Home
This home is located at 39 N Main St, North Easton, MA 02356 and is currently estimated at $535,389, approximately $491 per square foot. 39 N Main St is a home located in Bristol County with nearby schools including Easton Middle School, Oliver Ames High School, and Dovecrest Montessori Academy.
Ownership History
Date
Name
Owned For
Owner Type
Purchase Details
Closed on
May 28, 2025
Sold by
Johnson Murdoch M and Johnson Patricie A
Bought by
Johnson Ft and Johnson
Current Estimated Value
Purchase Details
Closed on
Jun 17, 2003
Sold by
Johnson 3Rd Murdoch M
Bought by
Johnson 3Rd Murdoch M and Johnson Patrice A
Purchase Details
Closed on
Oct 29, 1976
Bought by
Johnson Murdoch M and Johnson Patrice A
Create a Home Valuation Report for This Property
The Home Valuation Report is an in-depth analysis detailing your home's value as well as a comparison with similar homes in the area
Home Values in the Area
Average Home Value in this Area
Purchase History
| Date | Buyer | Sale Price | Title Company |
|---|---|---|---|
| Johnson Ft | -- | None Available | |
| Johnson 3Rd Murdoch M | -- | -- | |
| Johnson 3Rd Murdoch M | -- | -- | |
| Johnson Murdoch M | -- | -- |
Source: Public Records
Mortgage History
| Date | Status | Borrower | Loan Amount |
|---|---|---|---|
| Previous Owner | Johnson Murdoch M | $40,000 | |
| Previous Owner | Johnson Murdoch M | $40,000 | |
| Previous Owner | Johnson Murdoch M | $45,000 |
Source: Public Records
Tax History Compared to Growth
Tax History
| Year | Tax Paid | Tax Assessment Tax Assessment Total Assessment is a certain percentage of the fair market value that is determined by local assessors to be the total taxable value of land and additions on the property. | Land | Improvement |
|---|---|---|---|---|
| 2025 | $6,377 | $511,000 | $365,500 | $145,500 |
| 2024 | $5,658 | $423,800 | $278,300 | $145,500 |
| 2023 | $5,425 | $371,800 | $278,300 | $93,500 |
| 2022 | $5,254 | $341,400 | $249,500 | $91,900 |
| 2021 | $5,059 | $326,800 | $234,900 | $91,900 |
| 2020 | $4,880 | $317,300 | $225,400 | $91,900 |
| 2019 | $4,625 | $289,800 | $200,300 | $89,500 |
| 2018 | $4,433 | $273,500 | $189,600 | $83,900 |
| 2017 | $4,436 | $273,500 | $189,600 | $83,900 |
| 2016 | $4,313 | $266,400 | $183,100 | $83,300 |
| 2015 | $4,363 | $260,000 | $177,500 | $82,500 |
| 2014 | $3,924 | $235,700 | $154,100 | $81,600 |
Source: Public Records
Map
Nearby Homes
- 27 Holmes St
- 36 Elm St
- 16 Harlow St
- 8 Hobart Way
- 11 Olde Stable Ln
- 30 Owl Ridge Rd
- 49 Cosma Rd
- 16 Whittier Ln
- 224 Main St
- 33 Coughlin Rd
- 225 Main St
- 8 Riverside Terrace
- 56 Williams St
- Lot 8 Cooper Ln
- 17 Hayward St
- 93 Palisades Cir
- 283 Palisades Cir
- 104 Center St Unit 104
- 334-336 Main St
- 117 Center St