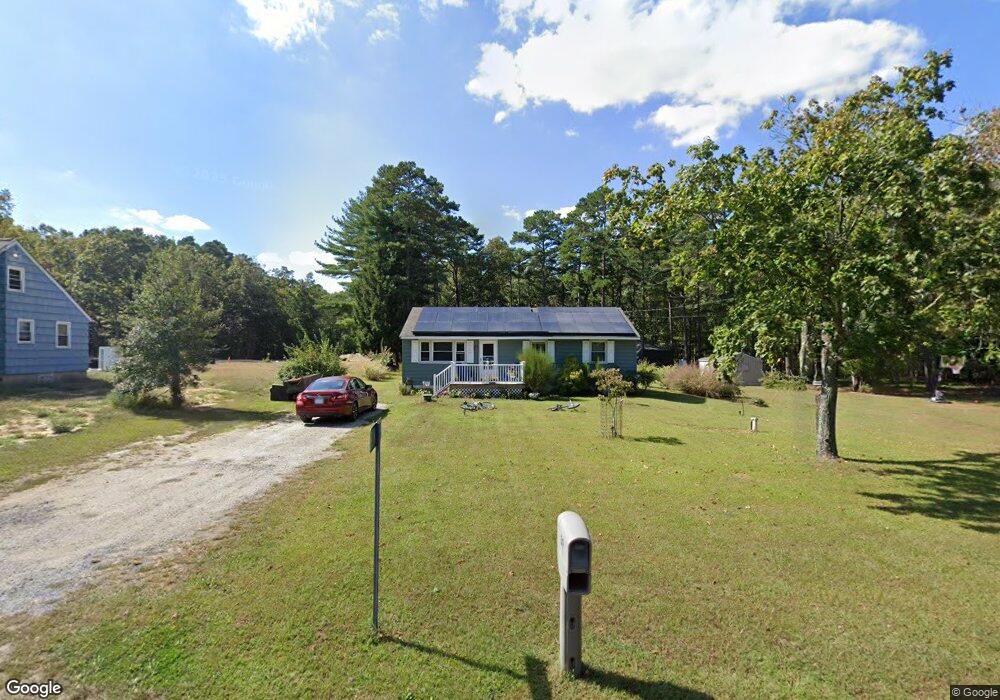
39 N Maple Ave Tuckerton, NJ 08087
Estimated Value: $166,000 - $401,000
3
Beds
1
Bath
1,008
Sq Ft
$268/Sq Ft
Est. Value
About This Home
This home is located at 39 N Maple Ave, Tuckerton, NJ 08087 and is currently estimated at $270,108, approximately $267 per square foot. 39 N Maple Ave is a home located in Burlington County with nearby schools including Bass River Twp Elementary School, Pinelands Regional Junior High School, and Pinelands Regional High School.
Ownership History
Date
Name
Owned For
Owner Type
Purchase Details
Closed on
Dec 10, 2016
Sold by
Rose Bonnie J
Bought by
Rose Bonnie J
Current Estimated Value
Home Financials for this Owner
Home Financials are based on the most recent Mortgage that was taken out on this home.
Original Mortgage
$164,624
Outstanding Balance
$135,177
Interest Rate
4.08%
Mortgage Type
FHA
Estimated Equity
$134,931
Purchase Details
Closed on
Jan 27, 2012
Sold by
Kalm David H
Bought by
Rose Lawrence and Rose Bonnie J
Home Financials for this Owner
Home Financials are based on the most recent Mortgage that was taken out on this home.
Original Mortgage
$175,437
Interest Rate
3.91%
Mortgage Type
FHA
Purchase Details
Closed on
Sep 12, 2006
Sold by
Kalm Elizabeth M and Kalm David H
Bought by
Kalm David H
Purchase Details
Closed on
Mar 2, 2004
Sold by
Kalm Elizabeth M
Bought by
Kalm David H
Create a Home Valuation Report for This Property
The Home Valuation Report is an in-depth analysis detailing your home's value as well as a comparison with similar homes in the area
Home Values in the Area
Average Home Value in this Area
Purchase History
| Date | Buyer | Sale Price | Title Company |
|---|---|---|---|
| Rose Bonnie J | -- | None Available | |
| Rose Lawrence | $180,000 | None Available | |
| Kalm David H | -- | None Available | |
| Kalm David H | -- | -- |
Source: Public Records
Mortgage History
| Date | Status | Borrower | Loan Amount |
|---|---|---|---|
| Open | Rose Bonnie J | $164,624 | |
| Previous Owner | Rose Lawrence | $175,437 |
Source: Public Records
Tax History Compared to Growth
Tax History
| Year | Tax Paid | Tax Assessment Tax Assessment Total Assessment is a certain percentage of the fair market value that is determined by local assessors to be the total taxable value of land and additions on the property. | Land | Improvement |
|---|---|---|---|---|
| 2025 | $2,363 | $108,200 | $60,500 | $47,700 |
| 2024 | $2,374 | $108,200 | $60,500 | $47,700 |
| 2023 | $2,374 | $108,200 | $60,500 | $47,700 |
| 2022 | $2,488 | $108,200 | $60,500 | $47,700 |
| 2021 | $2,410 | $108,200 | $60,500 | $47,700 |
| 2020 | $2,430 | $108,200 | $60,500 | $47,700 |
| 2019 | $2,644 | $108,200 | $60,500 | $47,700 |
| 2018 | $2,308 | $108,200 | $60,500 | $47,700 |
| 2017 | $2,321 | $108,200 | $60,500 | $47,700 |
| 2016 | $2,365 | $108,200 | $60,500 | $47,700 |
| 2015 | $2,384 | $108,200 | $60,500 | $47,700 |
| 2014 | $2,203 | $108,200 | $60,500 | $47,700 |
Source: Public Records
Map
Nearby Homes