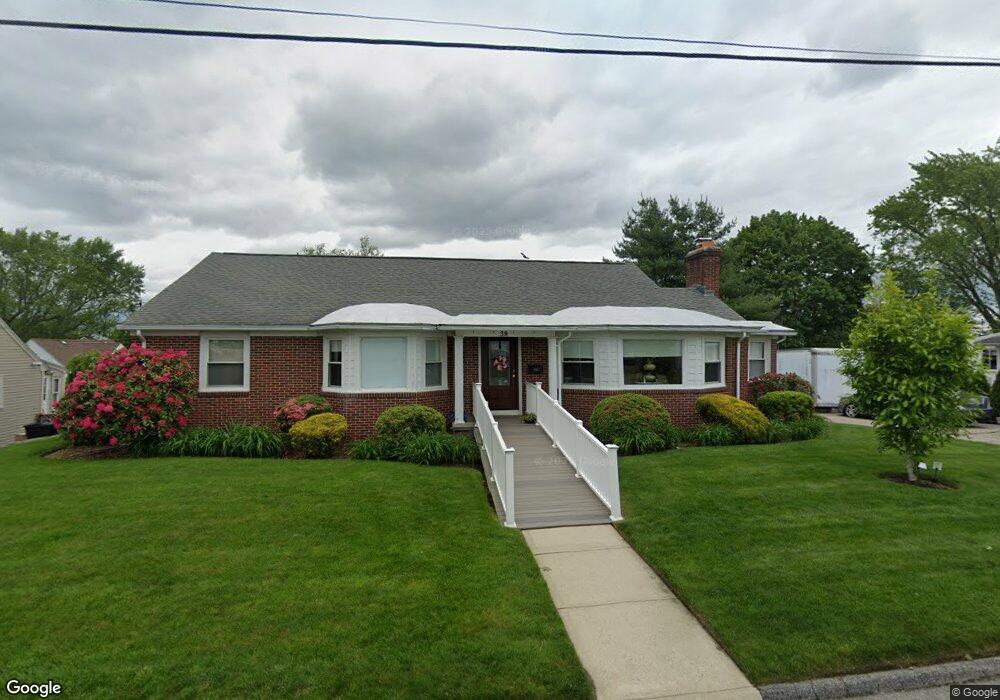
39 N Olney St Johnston, RI 02919
Killingly Street NeighborhoodEstimated Value: $493,946 - $686,000
4
Beds
2
Baths
3,499
Sq Ft
$159/Sq Ft
Est. Value
About This Home
This home is located at 39 N Olney St, Johnston, RI 02919 and is currently estimated at $556,237, approximately $158 per square foot. 39 N Olney St is a home located in Providence County with nearby schools including Johnston Senior High School, Achievement First Promesa, and Achievement First Providence Mayoral Academy Elementary School.
Ownership History
Date
Name
Owned For
Owner Type
Purchase Details
Closed on
Feb 15, 2017
Sold by
Jenkins Elaine M
Bought by
Jenkins Elaine M and Jenkins Steven A
Current Estimated Value
Purchase Details
Closed on
Sep 2, 2003
Sold by
Zararian Constance
Bought by
Campanelli Annetle
Home Financials for this Owner
Home Financials are based on the most recent Mortgage that was taken out on this home.
Original Mortgage
$199,000
Interest Rate
5.69%
Create a Home Valuation Report for This Property
The Home Valuation Report is an in-depth analysis detailing your home's value as well as a comparison with similar homes in the area
Home Values in the Area
Average Home Value in this Area
Purchase History
| Date | Buyer | Sale Price | Title Company |
|---|---|---|---|
| Jenkins Elaine M | -- | -- | |
| Campanelli Annetle | $222,000 | -- | |
| Jenkins Elaine M | -- | -- | |
| Campanelli Annetle | $222,000 | -- |
Source: Public Records
Mortgage History
| Date | Status | Borrower | Loan Amount |
|---|---|---|---|
| Previous Owner | Campanelli Annetle | $26,600 | |
| Previous Owner | Campanelli Annetle | $199,000 |
Source: Public Records
Tax History
| Year | Tax Paid | Tax Assessment Tax Assessment Total Assessment is a certain percentage of the fair market value that is determined by local assessors to be the total taxable value of land and additions on the property. | Land | Improvement |
|---|---|---|---|---|
| 2025 | $6,921 | $443,100 | $89,600 | $353,500 |
| 2024 | $6,779 | $443,100 | $89,600 | $353,500 |
| 2023 | $6,779 | $443,100 | $89,600 | $353,500 |
| 2022 | $6,695 | $288,100 | $66,400 | $221,700 |
| 2021 | $6,695 | $288,100 | $66,400 | $221,700 |
| 2018 | $6,185 | $225,000 | $49,400 | $175,600 |
| 2016 | $8,183 | $225,000 | $49,400 | $175,600 |
| 2015 | $6,456 | $222,700 | $49,900 | $172,800 |
| 2014 | $6,403 | $222,700 | $49,900 | $172,800 |
| 2013 | $6,403 | $222,700 | $49,900 | $172,800 |
Source: Public Records
Map
Nearby Homes
- 56 N Olney St
- 19 S Long St
- 33 Harding Ave
- 0 Orchard St Unit 1396400
- 0 Orchard St Unit 1400488
- 16 Homestead Ave
- 1143 Hartford Ave Unit 4C
- 1141 Hartford Ave
- 46 Auburn Ave
- 10 Mott St
- 24 Wilson Ave
- 102 Ophelia St
- 35 Hedley Ave
- 60 Ophelia St
- 2 Fairmount Ave
- 27 Greenville Ave
- 0 Eagle St
- 129 Glenbridge Ave
- 25 Vermont St
- 91 Clifton St
Your Personal Tour Guide
Ask me questions while you tour the home.