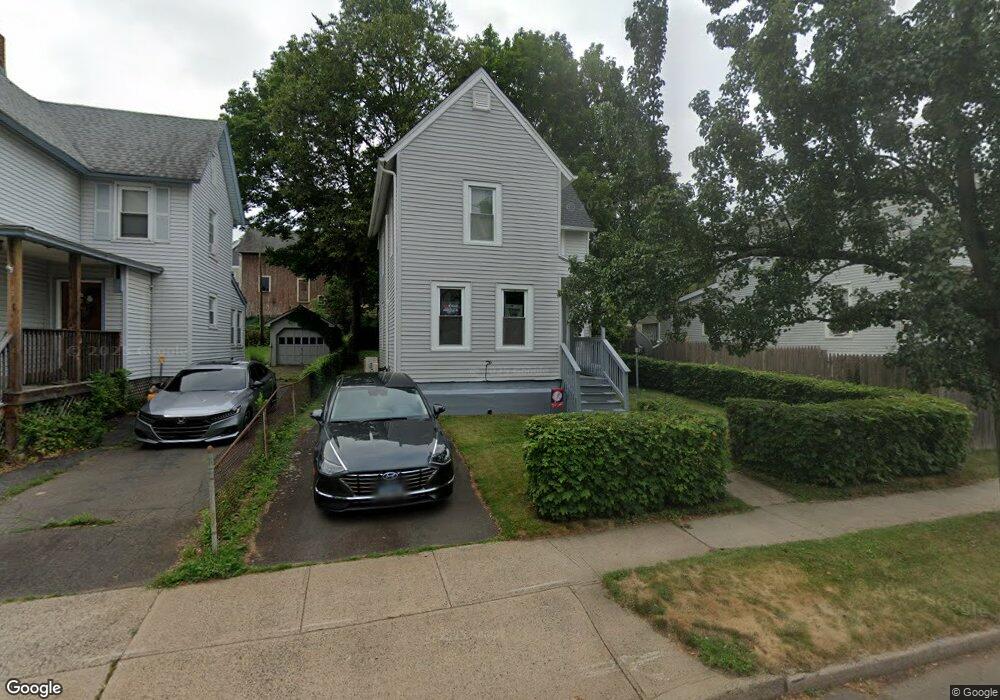
39 N Orchard St Wallingford, CT 06492
Estimated Value: $225,000 - $320,115
3
Beds
2
Baths
1,082
Sq Ft
$236/Sq Ft
Est. Value
About This Home
This home is located at 39 N Orchard St, Wallingford, CT 06492 and is currently estimated at $255,279, approximately $235 per square foot. 39 N Orchard St is a home located in New Haven County with nearby schools including Moses Y Beach Elementary School, Rock Hill Elementary School, and Dag Hammarskjold Middle School.
Ownership History
Date
Name
Owned For
Owner Type
Purchase Details
Closed on
Aug 6, 2025
Sold by
Secy Of Hsng & Urban Dev
Bought by
Primekey Real Estate Llc
Current Estimated Value
Purchase Details
Closed on
Jun 15, 1998
Sold by
Randlett Howard A
Bought by
Demusis Ralph
Create a Home Valuation Report for This Property
The Home Valuation Report is an in-depth analysis detailing your home's value as well as a comparison with similar homes in the area
Home Values in the Area
Average Home Value in this Area
Purchase History
| Date | Buyer | Sale Price | Title Company |
|---|---|---|---|
| Primekey Real Estate Llc | $224,900 | -- | |
| Demusis Ralph | $92,000 | -- | |
| Demusis Ralph | $92,000 | -- |
Source: Public Records
Mortgage History
| Date | Status | Borrower | Loan Amount |
|---|---|---|---|
| Previous Owner | Demusis Ralph | $100,000 | |
| Previous Owner | Demusis Ralph | $50,000 | |
| Previous Owner | Demusis Ralph | $64,000 |
Source: Public Records
Tax History Compared to Growth
Tax History
| Year | Tax Paid | Tax Assessment Tax Assessment Total Assessment is a certain percentage of the fair market value that is determined by local assessors to be the total taxable value of land and additions on the property. | Land | Improvement |
|---|---|---|---|---|
| 2025 | $4,156 | $172,300 | $70,400 | $101,900 |
| 2024 | $3,609 | $117,700 | $58,700 | $59,000 |
| 2023 | $3,421 | $116,600 | $58,700 | $57,900 |
| 2022 | $3,386 | $116,600 | $58,700 | $57,900 |
| 2021 | $3,325 | $116,600 | $58,700 | $57,900 |
| 2020 | $3,488 | $119,500 | $62,900 | $56,600 |
| 2019 | $3,488 | $119,500 | $62,900 | $56,600 |
| 2018 | $3,422 | $119,500 | $62,900 | $56,600 |
| 2017 | $3,412 | $119,500 | $62,900 | $56,600 |
| 2016 | $3,333 | $119,500 | $62,900 | $56,600 |
| 2015 | $3,126 | $113,800 | $62,900 | $50,900 |
| 2014 | $3,060 | $113,800 | $62,900 | $50,900 |
Source: Public Records
Map
Nearby Homes
- 43 Academy St
- 85 N Colony St
- 67 Spring St
- 29 Curtis Ave
- 148 Judd Square Unit 148
- 39 Hoffman Ct Unit B3
- 530 Center St Unit C1
- 180 S Whittlesey Ave
- 49 High St
- 212 S Orchard St
- 15 Marshall St
- 210 S Elm St
- 26 West St
- 91 Marshall St
- 40 Lake St
- 109 Clifton St
- 44 3rd St
- 30 Clinton Place
- 6 Holly Ln
- 57 Green St
- 43 N Orchard St
- 33 N Orchard St
- 47 N Orchard St
- 51 N Orchard St
- 29 N Orchard St
- 34 N Whittlesey Ave
- 38 N Whittlesey Ave
- 30 N Orchard St
- 42 N Whittlesey Ave
- 40 N Orchard St
- 36 N Orchard St
- 48 N Orchard St
- 95 Church St
- 99 Church St
- 57 N Orchard St
- 26 N Whittlesey Ave
- 52 N Orchard St
- 30 N Whittlesey Ave Unit Second Floor
- 30 N Whittlesey Ave
- 46 N Whittlesey Ave